The charts we looked at last week have some ‘hidden’ interesting features that I want to go into more detail on. This will get into mathematical derivations of metabolic equations, estimating Gross Efficiency, fuel utilization between fatty acids & glucose, and aerobic & anaerobic contribution to power output.
This might get complicated, but it will serve as reference for many future discussions on modeling VO2 and anaerobic power.
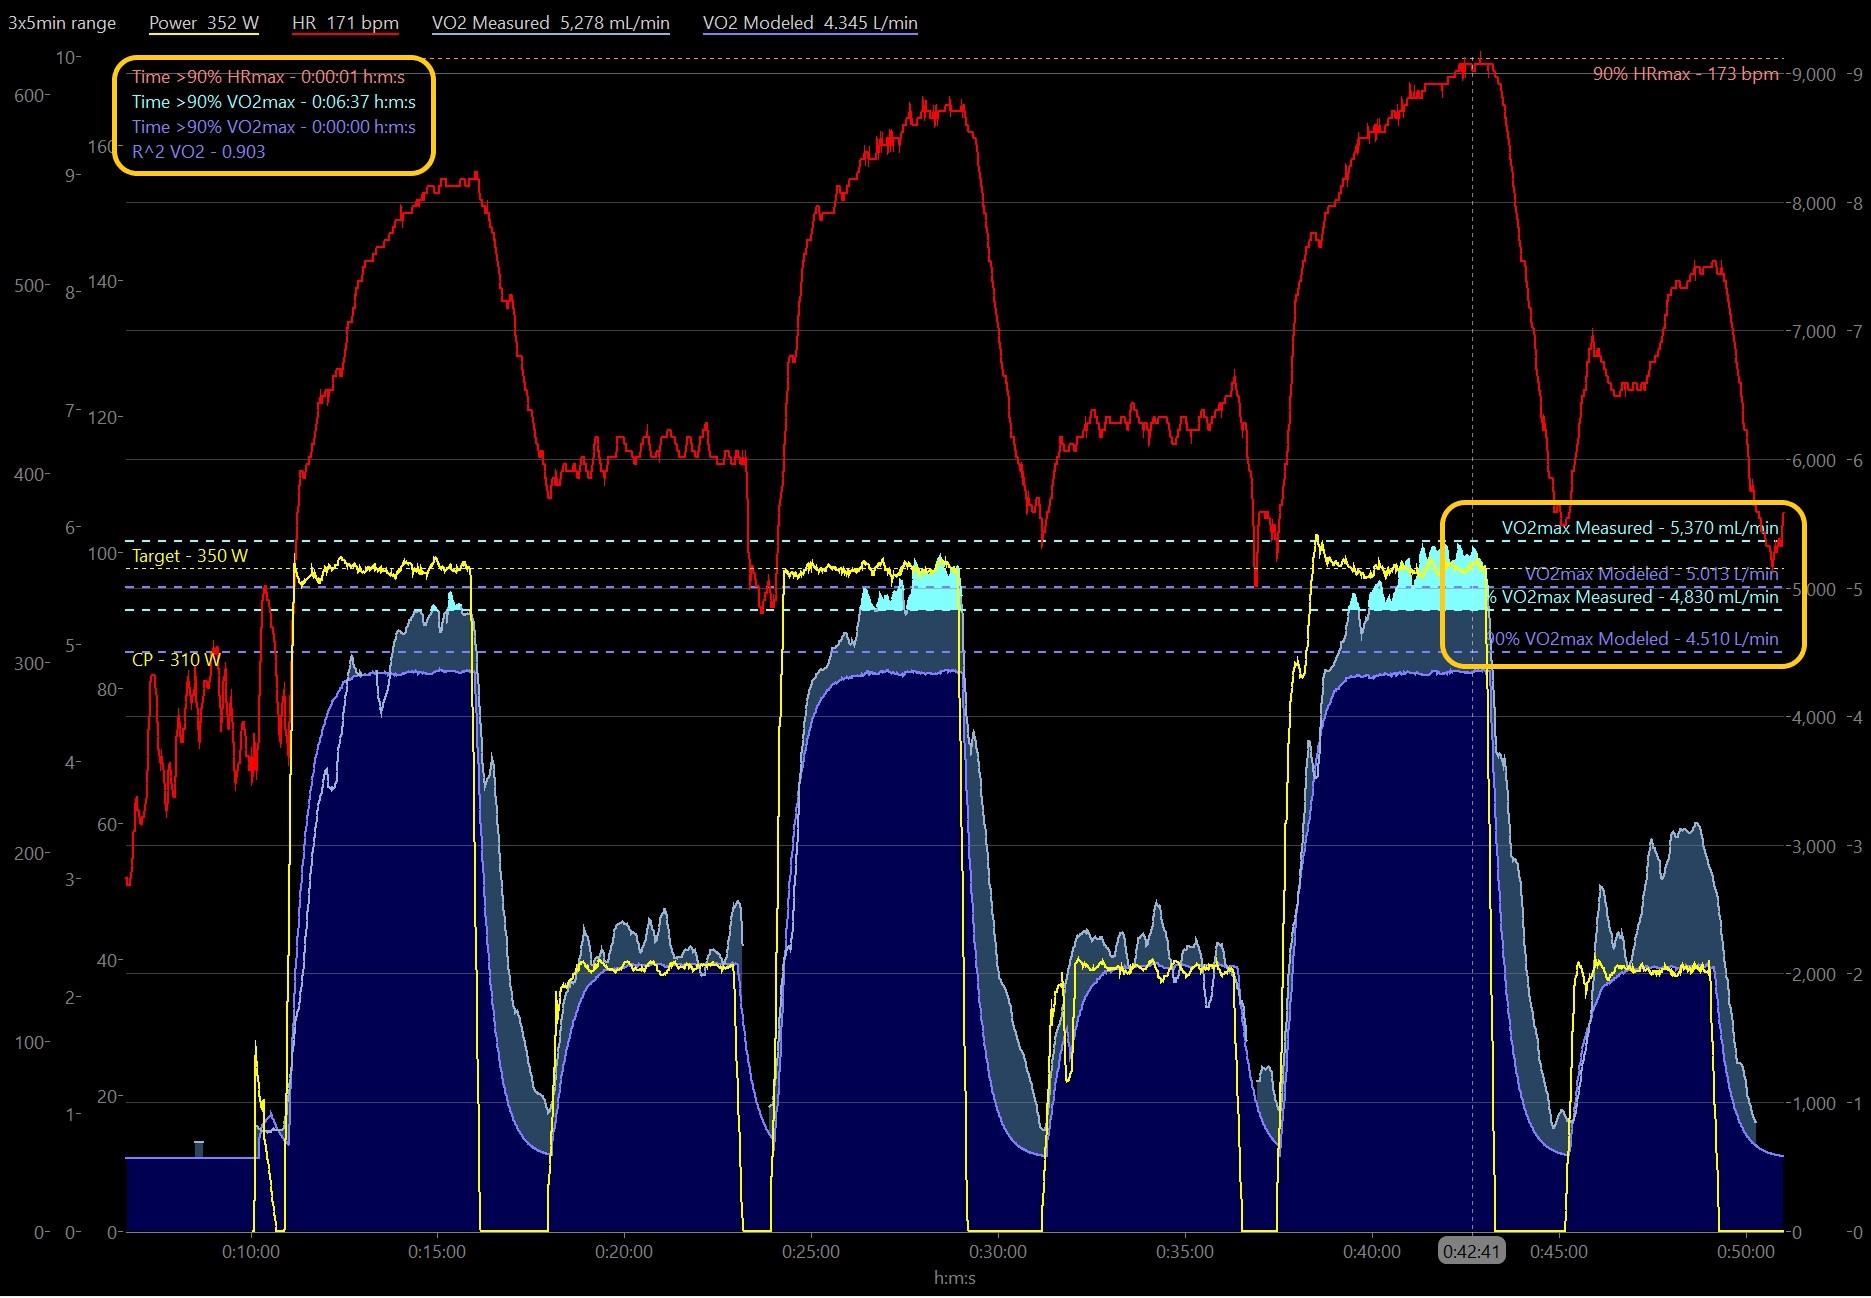
3x5min No Warm-up Intervals discussed last week
- Power in yellow
- Heart Rate in red, highlighted above 90% HRmax
- Modeled VO2 in Dark Blue (VO2 in mL/min) in the foreground, highlighted above 90% Modeled VO2max
- Measured VO2 in Light Blue in the background, highlighted above 90% Measured VO2max
Deriving Modeled VO2 from Power
My conclusion last week was that modeling VO2 from power alone is unfortunately too inconsistent and insufficient to provide additional value. Despite this I still think it’s valuable to understand how VO2 is modeled from power to understand it’s limitations.
WKO models VO2 by looking at 25-second weighted rolling average power. This gives a more gradual slope to the VO2 curve, in approximation of VO2 kinetics. From that smoothed power a known metabolic equation is applied using the athlete’s weight and some constant values. I believe it’s based on the ACSM formula for oxygen cost of cycling/leg ergometry.
3x5min no Warm-up Intervals
Raw and smoothed Power in yellow, and Modeled VO2 in dark blueNote how the shape of the Modeled VO2 curve mirrors power. However the two lines are scaled to different y-axes. There is a method to the power-VO2 scaling. Keep reading!
This formula converts Power in watts into estimated VO2 in L/min.

This conversion is simple enough. Especially since all the relevant calculations are built into WKO. For the reverse process of calculating power from VO2 I had to learn the conversion & formulae for myself.
Deriving Power from Measured VO2
If we already have measured VO2 it’s actually a pretty simple calculation to derive power. However confirming all the math and the theory behind it took some time. The calculation starts with the known energy production of oxidizing glucose (Péronnet & Massicotte, 1991) and ends with the Gross Efficiency method of calculating aerobic contribution to power output (Noordhof et al, 2011).
Let me start with the heavy math, then talk about the application. Feel free to skip this section unless you want to check my work!
GE Method
A few methods exist for calculating power from VO2. The so-called ‘GE Method’ uses Gross Efficiency (GE) and either Respiratory Quotient (RQ) or Respiratory Exchange Ratio (RER; functionally the same thing) to calculate aerobic contribution to power output.
RQ or RER is the ratio of VCO2/VO2. GE is the experimentally derived difference between internal energy production and mechanical power output, accounting for losses as heat. Both of these values require measuring both VO2 and VCO2. This poses a problem since VO2 Master Pro currently only measures O2 and not CO2. So we have to make some assumptions, which I’ll get into below.
GE Method, from Noordhof et al, 2011
- Paer = PI * GE
- where Paer is aerobic contribution to mechanical power output (W )
- PI is metabolic power produced internally (W )
- GE is gross efficiency (%); the difference between PO (power output measured by the power meter) and PI.
- PI = VO2 * O2eq
- VO2 is volume of O2 consumption in L/s
- O2eq is energy equivalence of O2
There are two slightly different constants given for O2eq. The first and more established equation is derived by Garby & Astrup, 1987 from the nonprotein respiratory quotient table developed by Lusk, 1924:
O2eq = 4940 * RER +16040 (arb. units)
However, apparently this table has been updated with slightly more precise values by Péronnet & Massicotte, 1991. I see a mix of both constants used in contemporary literature… which is very confusing. I don’t know enough about the history here, or which table is commonly accepted. My inclination is to use the updated values, so this is what I will be using for the remainder of the article.
From Péronnet & Massicotte, 1991, if we assume 100% glucose metabolism:
O2eq = 5.189 kcal/L = 21.7 kJ/L
This gives us a final formula for deriving aerobic power:
Paer (W ) = VO2 (mL/min) * O2eq (kJ/L) * GE (%) * 1/60 (s)
What’s the point of this conversion? The first idea was to be able to visualize VO2 and Power on the chart at the same y-axis scaling. Such that power output and VO2 ‘input’ would be displayed at the same point on the chart.
Briefly: at any power output, some portion of that power will be produced aerobically and can be accounted for by VO2. Under most conditions, some further portion of power will be produced anaerobically, beyond what can be immediately accounted for by VO2. (This is made up for by excess post-exercise O2 consumption, or O2 debt). If we can visually see how closely VO2 and power match at any given time, that should give us some information on how much of that power is being directly produced aerobically.
We can then infer that any gap between VO2 and power is either coming from anaerobic sources (visualized further below), or reflects a meaningful change in either metabolic efficiency (GE) and/or fuel utilization (fat or carb oxidation).
3x5min no Warm-up Intervals
Power in yellow and Measured VO2 in light blueNote near the end of the two ‘warm’ intervals (2 & 3) power and VO2 are approximately at the same point. This suggests close to 100% of the power produced at those points were being produced aerobically.
The first ‘cold’ interval shows a bigger gap between VO2 and Power. This probably reflects increased anaerobic contribution to power during this interval compared to the following intervals.
Note PVO2max (power at VO2max) reported under the VO2max dotted line. This is the power value calculated from the Paer equation. Very close to the power we see in reality when I was approaching VO2max.

Because VO2 Master Pro only analyses O2 without CO2, I cannot calculate either RQ or GE. So I have to make some significant assumptions to build a working power model from only VO2 measurement.
The major assumption is that RQ is always equal to 1.00. This gives us the predictable value for O2eq = 21.7 kJ/L for the Paer equation (detailed above in the heavy math).
In reality RQ will change moment by moment with intensity and with factors such as fuel availability. RQ ranges from ~0.70 to ~1.00 for 100% fatty acid oxidation and 100% glucose oxidation, respectively. RQ tends to be lower (ie. greater relative fat burning) at lower intensities, and higher (ie. greater relative carb burning) at higher intensities.
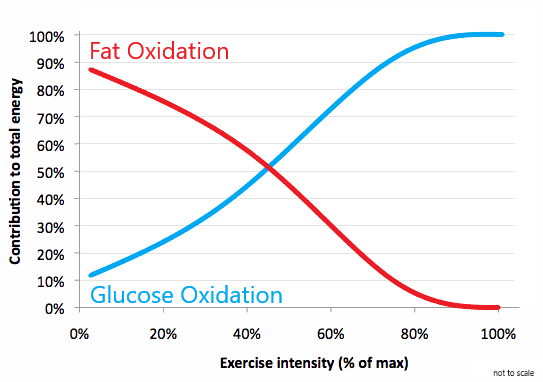
Representation of fat & carb oxidation across intensity
RQ is impossible to predict without direct measurement. So this assumption will tend to overestimate aerobic power at most submaximal workloads. However the maximum difference is typically only 20-30 W. I think this assumption is an acceptable limitation until measuring RQ directly becomes feasible.
Given Assumption 1 we can solve for Gross Efficiency, which is the other unknown value in the Paer equation. GE tends to be ~20%. From my experimentation applying the Paer formula, the resultant estimated GE values for appropriate workouts seem to fall within a range of ~18-23%. This is in line with expectations.
Ultimately, the numbers that come out from this equation roughly make sense considering the stated assumptions and limitations. I’ve successfully been using the Paer equation as an estimate for power at VO2 (PVO2) and the scaling keeps everything visually coherent in the charts.
Aerobic & Anaerobic Power
The final big application of the VO2 to power conversion and the chart scaling is that I can display estimated ‘anaerobic power‘ without any additional calculations. This is the power produced beyond what VO2 can account for. This won’t be a perfectly accurate number, for all the assumptions given above, but it gives us another visual reference point and lets us compare things like time and training load.
(edit: this looks similar to a feature that was just introduced in WKO5, which is probably implemented a heck of a lot more cleanly than my method. I’ll have to explore and report back!)
3x5min No Warm-up Intervals
Measured VO2 from VO2 Master Pro and Modeled VO2 from WKO4Once again, I’m making a lot of assumptions on how VO2 converts to power, so take this as a very rough estimate. It’s an imperfect model intended to represent how the two energy systems interact to meet power demand. Honestly, it could be argued this model is over-extrapolating the data just like the VO2 model I discussed last week. But I think the additional information provided from this chart has added value to training prescription. Let’s just be aware of the application and the limitations.

At the onset of the work interval (especially the first ‘cold’ interval above) the aerobic system can’t produce enough instantaneous energy to meet the sudden power demand. Anaerobic energy production pathways are able to respond rapidly to meet this demand by consuming resources stored directly in the muscle. Meanwhile the aerobic system takes ~60-90 seconds to ramp up in the background to match supply to demand. Aerobic pathways then continue to work to recover some of the depleted anaerobic resources (O2 debt, mentioned above).
Relative Workloads and Energy Contribution
Let’s finish by looking at the workloads for energy burned (kJ) by the aerobic system above 90% VO2max, and the anaerobic system for the 3x5min intervals.

This report omits the recovery intervals
Time accumulation shows I spent most of the 15min of “VO2max work” burning some anaerobic energy to produce the target 350 W. During the entire first ‘cold’ interval, and most of the subsequent two ‘warm’ intervals, I was producing at least some energy anaerobically while my aerobic system slowly ramped up to 90% VO2max.
However the workloads (in kJ) show how important aerobic energy contribution is to the target workload. Over 3x more energy came from aerobic pathways when I was above 90% VO2max, than the total energy from anaerobic pathways.
This is just a small example of how significant aerobic contribution is to power output at virtually all intensities. Even maximal 1min or 30sec efforts show a surprisingly large contribution from aerobic energy pathways, which is something we’ll look at in the future. Cycling is an endurance sport, first and foremost. Our aerobic system is by far the most important component of our fitness on the road.
Next time I want to share some more interesting comparisons of measured & modeled VO2, with aerobic & anaerobic power contribution during intermittent high intensity intervals. And a very cool look at real-time measured VO2 data from inside a Cat 1/2 Crit race! Keep an eye out for that.

Great stuff. I look forward to your posts regularly.
LikeLiked by 1 person
Dear Jem,
Great posts and lots of highly interesting nitty-gritty details that anyone who starts to analyze these concepts will need to go through in order to understand some of the complexities.
A quick question unrelated to the specific VO2 post. To me 90% of HRmax just seems a bit too low to actually make any improvements but I may be wrong here? To exemplify: 4 x 4 minutes classic steady state high intensity intervals at 90% HRmax just feels too easy (RPE 15-16). I might have my HRmax wrong but in order to reach a perceived intensity of “very hard” (RPE 17-19) I need to go to 93-95% of HRmax. What’s your view on this? Best regards / Björn
LikeLike
Thanks Björn, You’re probably correct for your own interval prescription. One of the limitations of using %HRmax as a surrogate for VO2max is that it’s individual and protocol dependent. There is no consistent relationship between Power-HR-VO2 as far as I can see. 90% HRmax is a starting point, but you have to use HR and RPE based on your own particular workout prescription. You’re taking the right approach in that respect.
For you, 90% HRmax may indeed be too low a target for 4x4min steady-power intervals. The options then are either to increase intensity for the same duration (4min), or increase duration at the same intensity (15-16 RPE). I’d suggest you may get more benefit from longer duration at slightly lower intensity. eg. Seiler’s 4x8min intervals ended up at 90% HRmax (in the final 25% of each interval) and 16.4 RPE. If you hit 90% HRmax early with a hard-start and maintained that for the full interval duration, I would suspect RPE and VO2 would be significantly higher.
LikeLike
Subject: Accumulated Time in VO2max Zone
Hello Jem! Here is a question that I was considering during my run this morning. With a goal of achieving 10+ minutes at >90% HRmax during a VO2max bike workout, should that accumulated time only be calculated from within the work intervals – OR – should it also include the time “in zone” directly following each work interval as well?
For instance, during my VO2max bike workout yesterday morning (4×4:40 with 4 min recoveries), my time >90% HRmax was 7:42 during the work intervals. However, I remained >90% HRmax for a short while after each interval as well (during the recovery period). So, “total” time >90% HRmax was 9:11. Which is the more valid time to consider as being >90% HRmax for the purpose of adaptation: 7:42 or 9:11?
FYI, based on your blogging, I am going to make a couple modifications to this workout in the future:
(1) For the first interval, incorporate a fast-start to hopefully get into >90% HRmax during that first interval.
(2) For the second interval, incorporate a less extreme fast-start to get into zone a little quicker.
(3) Keep the remaining two intervals constant, as both were very challenging and “in zone” soon enough.
Thanks for your work on this site, and engagement with the community. Awesome material here!
JD
LikeLike
Love the level of methodological detail in this question JD.
Certainly HR and VO2 will remain elevated immediately after the end of each interval. That’s part of the idea behind intermittent workouts like the 30/15s, where the brief recovery periods are sufficiently short that VO2 remains elevated.
If we talk about onset kinetics for VO2 & HR – basically how quickly do they respond to changes in workload – VO2 kinetics are slightly faster than HR kinetics. Meaning VO2 will rise and drop faster than HR at the start/end of each interval. You can just about see this in the VO2 & HR tracings for the workouts in this article.
If we also think about what drives the adaptive signal, it’s the maintenance of pace/power high enough to drive essentially an O2 supply-demand mismatch. VO2 >90% is a measurable supply-side response to that O2 mismatch, but I think the workload demand is probably more relevant to actually driving that adaptive signal. ‘Power-only’ proponents have that right, I think. 🙂
All that being said, I think I would keep the conservative estimate of counting time >90% VO2max/HRmax only during the intervals, ie. when power/pace are elevated at target. I want to say it probably doesn’t make much of a difference, but an additional +90sec or nearly +20% on top of your workout duration certainly is significant when tracking duration! Let’s keep ourselves honest by hedging low.
Thanks for bringing this question up, because I haven’t sat down and really considered it. All my charts show simple accumulated time across the entire workout (or selected portion thereof). I’ll have to update how I track this. If I’m measuring VO2 directly I’ll probably continue to use ‘net activity time’. But for HR or modeled VO2 I’ll likely switch to using ‘workload-only time’.
Jem
LikeLike
Hi Jim, I am a runner learning WKO4. Your blog is very interesting. I apologize for the “running question”, but you might be able to help me. How accurate to “PI” would the following formula be? Internal power = 0.140 * 10 ^ (- 0.2 * metric (speed) /3.6/cadence*2/60) * (metric (speed) /3.6) ^ 2 * cadence * 2/60. If a good approximation, the GE (Paer) formula would be very easy, however it would not be related to VO2
LikeLike
Hi Alfonso, can you break that equation down for me or give me a reference for it to look it up? I’m not sure what half of the values are supposed to represent. If it’s trying to estimate internal work from speed and running cadence alone I would be very skeptical of the value in estimating GE from that. Seems like stacking too many unknowns. Stryde probably has some decent resources on the challenges of estimating real-world running power, nevermind the internal work required to produce that power.
Like cycling power, you might be able to use the estimate as a rough approximation if you squint hard enough. But when you stacking assumptions like this, I think the error margins just become way too wide to be of any real value.
But I’d be interested to hear otherwise!
LikeLike
Jem thanks a lot for your quick response.
Every thing bring from here:
https://m.facebook.com/groups/1601263496865478?view=permalink&id=1855917411400084
I am a trail runner with Stryd and I have real RER for VT1 and VT2. Especially I was looking to estimate the consumption of Kcal as a function of speed, slope, fatigue, …, to plan nutrition in training and competitions. Maybe this is too difficult for me 😅.
Slope (uphill and downhill) and terrain y a hándicap for everything (W, VO2,…)
LikeLike
Thanks for the link Alfonso. Fascinating bit of insight into the development of the Stryde formulae.
I think what you are trying to accomplish is reasonable. Would be a useful exercise to get a broad idea of fueling requirements. You could use your measured RER across power outputs to estimate substrate/fuel use during uphill/downhill racing. You could try modeling an estimated Fatmax curve from your testing and extrapolate that to your pacing strategy as well, especially if you are competing in longer/Ultra events.
However remember RER is very sensitive to inputs (diet) and daily variation. If you eat a big carb breakfast before the test measurement, your RER will tend to be higher at all intensities. And vice-versa if you go into the test with a big fat breakfast or fasted. But if you prepared for the test similar to how you would prepare for the race, it may be comparable.
Also consider that RER changes during prolonged exercise, although possibly not by much (see Hopker et al, 2017, https://pubmed.ncbi.nlm.nih.gov/26993076/). Although the direction and magnitude of change may be inconsistent, from the very limited 1st-hand testing I’ve done.
When I model RER & GE during testing with the VO2 Master, which doesn’t measure VCO2 and therefore can’t calculate RER, GE, or substrate use. I do something similar to what you suggest. I use average numbers from previous testing, or simple averages. ie. RER = 0.845 (50/50% fats & carbs = 20.969 kJ/L O2) and GE = 20%. Then I can tinker with these two inputs to see how the output change within a range (eg. internal work, Paer, kJ and fuel requirements).
Sounds like an interesting project!
Jem
LikeLike
Hi Jem,
Fascinating article, thank you. Could this formula be used to calculate power on an erg double polling machine or would the formula have to be adapted?
LikeLike
Hi Simon, Thanks!
The ACSM/WKO formula for estimating VO2max from power is cycling specific.
The stochiometric equation for calculating aerobic energy expenditure is not sport or modality-specific and can be used for anything.
This technical proposal about which equation to use may be of interest. My preference is to use Péronnet & Massicotte, 1991 equation, as mentioned in my article.
LikeLike
Hello,
this is a very interesting article, thank you.
I just have a small question about the equation developed by WKO5 to estimate VO2max.
Do you know it?
I tried to look for it but I didn’t find anything unfortunately…
Thanks in advance!
LikeLike
Thanks Damien. I don’t know for sure, but it’s likely the VO2max estimation equation is based on the ACSM formula, which is listed in the article. Probably with some additional black-box magic from any of the other data WKO has in the athlete
LikeLike
Thank’s a lot for sharing your knowledge
LikeLike
Is there a simple equation to use to take a tested VO2 max value that is expressed in ml/kg/min oxygen consumption and convert that into a power (watts) number that I can plug in to Training Peaks to calculate my zones more accurately? It may be here in your article, but it’s not apparent to me. Thanks.
LikeLike
Hi Doug,
There is not. VO2 max/peak can be attained from many different power outputs over shorter or longer durations.
If you have a lab tested VO2peak value, you should also have a peak power output from the test protocol which you might use. For example, maybe the power associated with VT2 can be used as FTP and the peak incremental power can be the top of your ‘high intensity aerobic’ zone (whatever number or name that zone represents for you). Not saying that’s entirely accurate or valid or the best approach, but it’s a thing you could do and not be way off the mark 🙂
If you do not have a lab tested VO2peak value, you might as well generate training zones from any popular performance test. Ramp/step test, 20 min, 60 min, power profiling, etc. Take your pick.
General advice: the precise demarcation between zones don’t matter nearly as much as knowing generally which zone or intensity domain you are in, and being in the one you intend to be in. e.g. if you intend to perform interval training above your maximal metabolic steady state / critical power / FTP, it doesn’t really matter by how much you’re above that, as long as you can do the prescribed training volume consistently. Lower workload closer to that threshold for longer intervals, higher workload for shorter intervals.
Hope that helps,
Jem
LikeLike
It does. Thank you, Jem. When I did the lab test, it was on a treadmill, so no power measurement. Appreciate all the work that people like you do for our community!
LikeLike