I have been and will be writing a lot about muscle oxygenation. I should have started with an overview of how muscle oxygenation is measured with near-infrared spectroscopy. Let’s go through that now, from simple to more complex.
On our way we can consider some of the many unresolved questions about how to interpret the information contained in oxygenation signals, and speculate on the implications for endurance performance.
Muscle Oxygenation and Near Infrared Spectroscopy
Muscle Oxygenation refers to the flux of oxygen within a target tissue as the result of metabolic respiration. Delivery of oxygenated blood (Q̇O2) from the heart & lungs and uptake or extraction of oxygen by the mitochondria within the local muscle (V̇O2, or more specifically mV̇O2).
This is measured with a technology called near-infrared spectroscopy (NIRS). Moxy is a portable NIRS sensor. There are other sensors with slightly different, some more advanced technologies, but all NIRS sensors work roughly the same way.
As the name suggests, NIRS bounces near infrared light into the tissue below the sensor and interprets the colour of the returning light. If you were to hold a flashlight against your hand, this would be similar to how the light turns red as it shines through your translucent tissues.

Schematic of near infrared spectroscopy (NIRS) bouncing light into the microvasculature bed of a tissue.
This optical signal is sensitive to the oxygen carrying molecules within the microvascular bed under the sensor. Oxygen is primarily bound to proteins called hemoglobin (Hb) within blood and myoglobin (Mb) within muscle tissue. NIRS detects the combined volume of both, but is often referred to simply as ‘hemoglobin’. I’m attempting to follow Barstow’s (2019) advice and refer to them together as ‘heme‘.
Most NIRS sensors measure the volume of heme bound to or ‘saturated’ with O2 called oxygenated heme (O2Hb). And unbound or unsaturated deoxygenated heme (HHb). The sum is total heme (THb). The volume of O2Hb relative to THb (O2Hb+HHb) gives a tissue saturation index (TSI), or muscle oxygen saturation (SmO2) as a percent.
Note: references for much of the information in this article are based on these foundational NIRS review paper below. Other sources are linked where appropriate. I’ve tried to synthesize the most relevant information pertaining to muscle oxygenation in an exercise context for this overview article.
Boone et al, 2016. An Integrated View on the Oxygenation Responses to Incremental Exercise at the Brain, the Locomotor and Respiratory Muscles
Grassi & Quaresima, 2016. Near-infrared Spectroscopy and Skeletal Muscle Oxidative Function in Vivo in Health and Disease: A Review From an Exercise Physiology Perspective
Perrey & Ferrari, 2018. Muscle Oximetry in Sports Science: A Systematic Review
Barstow, 2019. Understanding Near Infrared Spectroscopy and Its Application to Skeletal Muscle Research
Hamaoka & McCully, 2019. Review of Early Development of Near-Infrared Spectroscopy and Recent Advancement of Studies on Muscle Oxygenation and Oxidative Metabolism
Specific Considerations of the Moxy Muscle Oxygen Monitor
Moxy as far as I can tell behaves slightly differently from other NIRS sensors, due to it’s small portable size and application for field use. It uses advanced algorithms to report a relatively scaled measure of the total volume of heme (THb) attributable specifically to the muscle layer under the sensor. It can then evaluate the relative saturation (SmO2 %) of that heme volume.
In our experience Moxy is able to capture the full expected range of oxygen saturation (from <20% to >80%), and shows a good relationship to other metabolic measurements (VO2, HR, etc.); to external workload (power output); and to performance outcomes (thresholds, time to exhaustion, TTs, etc.).
I’ve tested myself with Moxys for over two years and the signals have been very reliable. I’ve learned what certain target values or signal behaviours mean for me, in terms of form, fatigue, muscle recruitment, and even injury and recovery status. Although it has taken a long time and a lot of data crunching to build this kind of metabolic profile of myself from scratch, the process will certainly scale to other athletes as I’ve built the tools to interpret Moxy data within a broader training context.
One of the next steps we are currently exploring is how to use Moxy data in real-time to guide interval training and pacing, and how it relates to established VO2 targets. And of course exploring SmO2 profiles of different muscles during high intensity intervals and physiological testing.

However the main limitation of Moxy, related to it’s small size, is that it has a relatively small penetration depth of the optical signal into the tissues. Such that higher subcutaneous fat thickness will strongly influence the data. Thicker adipose tissue within the relatively shallow signal depth means less of that signal will reach the target muscle tissue below.
This has especially been a concern with lean female athletes, who still tend to have higher adipose thickness, especially at their thighs compared to males. This also affects measurement at other sites such as the gluteal muscles, the prime mover of the hip-joint during cycling and an important focus of my own work.
In addition, the algorithm Moxy uses to optimize the signal within the muscle layer may be related to the finding in some papers that THb has a smaller than expected amplitude of change during exercise, while SmO2 has a greater amplitude compared to other common NIRS devices (Crum et al, 2017; McManus et al, 2018).
A device that captures all tissue layers (skin, fat, and muscle) below the sensor may show a greater change in blood volume with temperature- and exercise-induced redistribution of blood flow. And since those upper tissue layers are far less metabolically active than muscle, much of that blood volume would remain saturated as O2Hb, resulting in a higher SmO2 and therefore less dynamic range when these tissues are contributing more to the overall NIRS signal.
Previous research using Moxy devices has tended to report SmO2 rather than use THb to derive O2Hb & HHb due to these limitations. We have followed that trend which is why you will usually see our data discussed in terms of SmO2 only.
References for Moxy functionality & validity: Crum et al, 2017; McManus et al, 2018; Feldmann et al, 2019; Andri Feldmann gives more information on how relative SmO2 is measured on his YouTube channel; And Roger Schmitz gives more information on the Moxy algorithm at the 2020 Moxy Summit.
What Goes On Behind the Scenes of the NIRS Signals?
Because of the unpredictable nature of how NIR light bounces around and scatters within the tissue, NIRS signals represent relative oxygenation. The NIRS signal is like a series of instantaneous snapshots into the tissue. We can see the ratio of oxygenated and deoxygenated heme at each snapshot, and we can see how that ratio changes between snapshots. But because of differences in tissue optical properties, we cannot determine absolute values of blood flow (Q̇) or oxygen uptake (mV̇O2) without more invasive protocols.
Although more advanced NIRS devices are making that a more realistic possibility.
The measurement of muscle oxygenation therefore reflects a dynamic balance of local O2 delivery, and O2 extraction within the tissue.
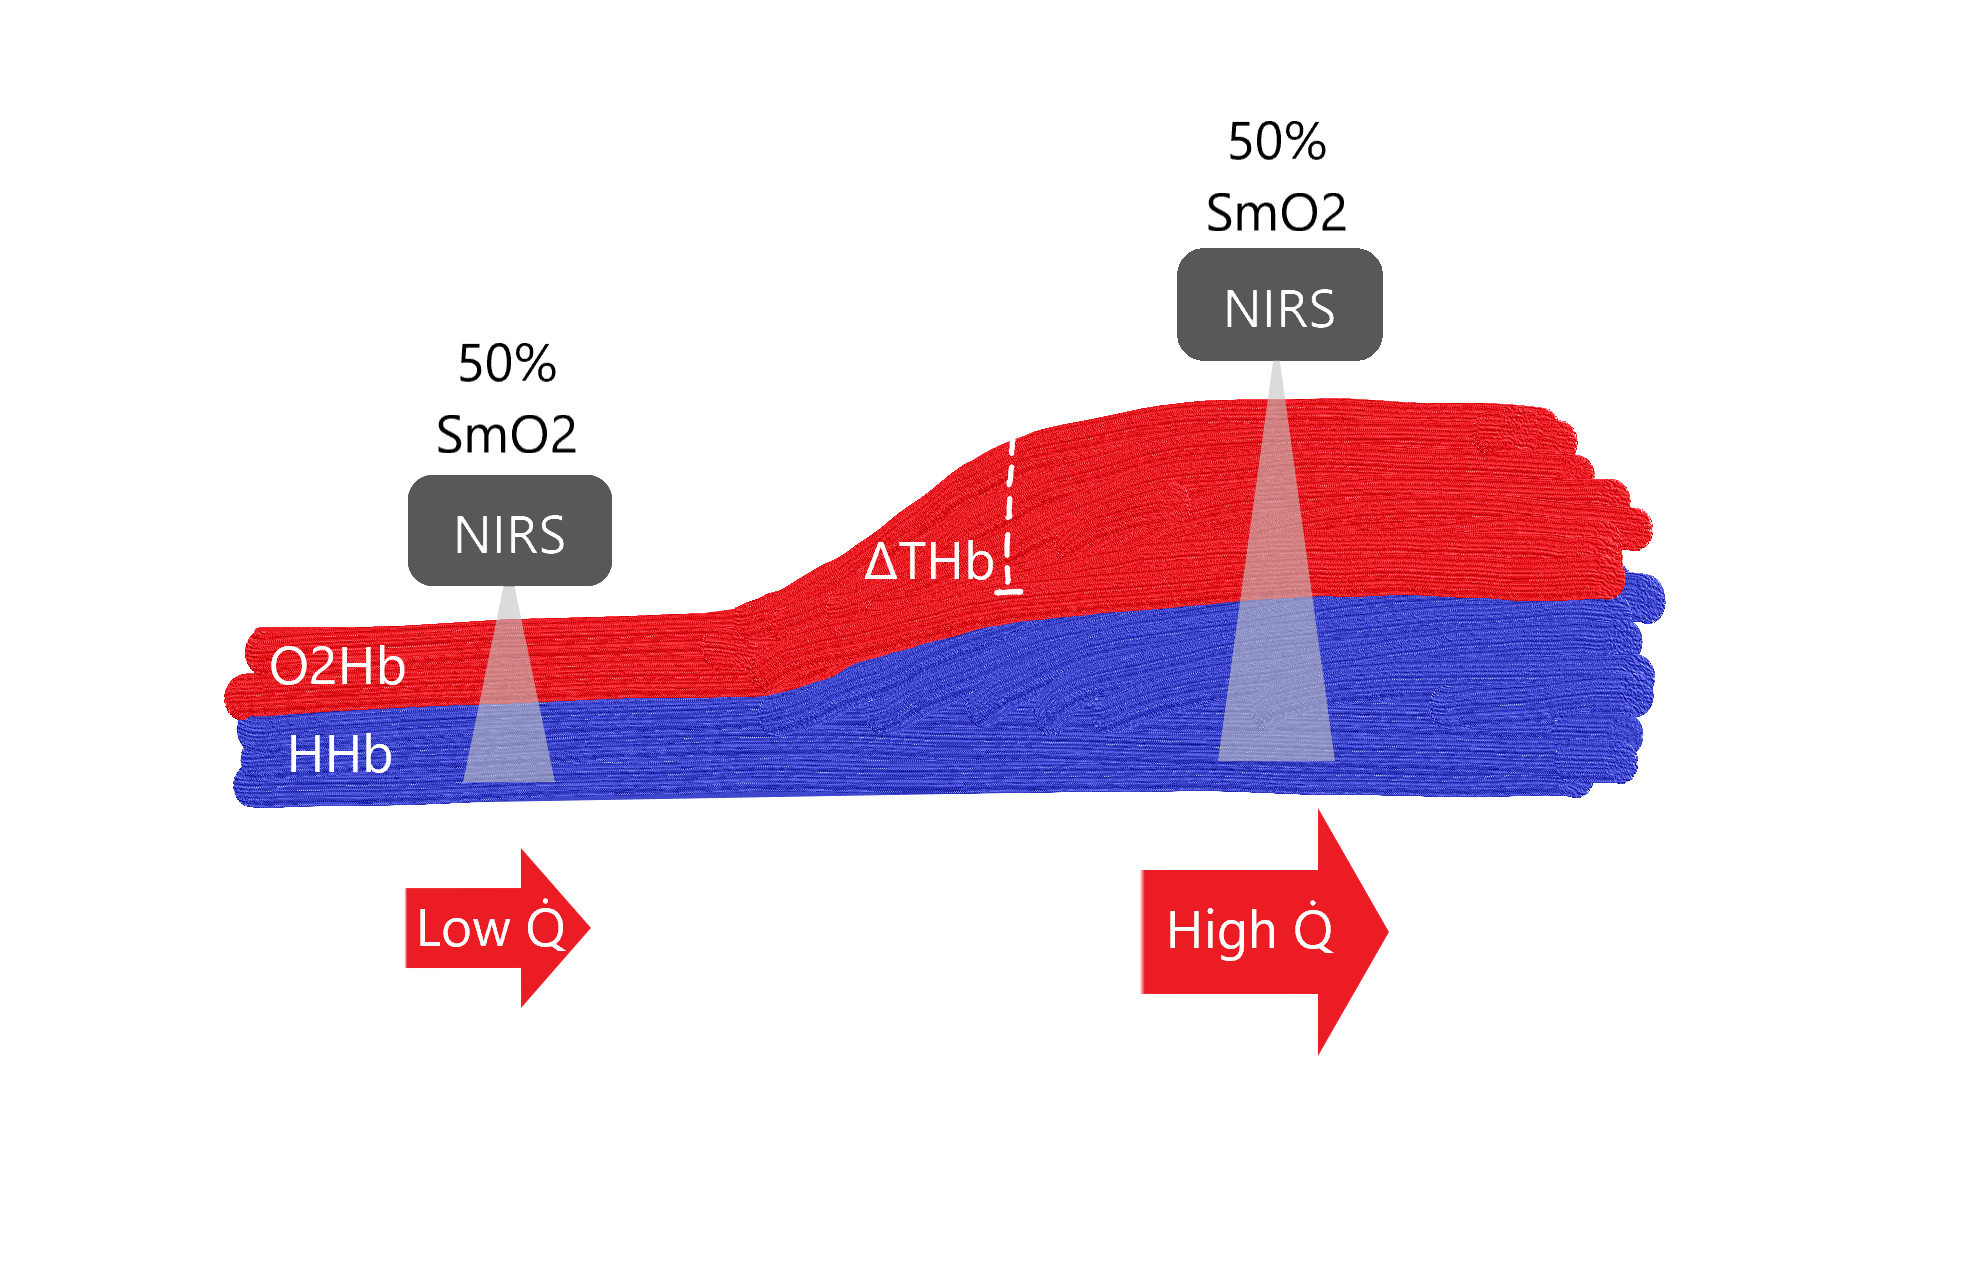
Rough schematic of blood volume within a tissue vascular bed, representing an increase in heme (ΔTHb) and corresponding change in blood flow (Q̇), for example during exercise. Very not to scale.
A relative NIRS sensor such as Moxy will report ~50% muscle oxygen saturation (SmO2) at both ‘snapshots’, despite very different absolute magnitudes of oxygenated (O2Hb) and deoxygenated (HHb) heme.
Total heme (THb) will show an increase in relative blood volume under the sensor, but blood flow (how quickly that volume is moving through the tissue) remains unknown. Therefore absolute values of O2 delivery and muscle O2 uptake cannot be quantified.
For this reason the data are best interpreted in terms of dynamic change: when SmO2 is increasing it means the dynamic balance of O2 delivery is relatively greater than O2 extraction. When SmO2 is decreasing it means extraction is relatively greater than delivery.
The rate of change (ie. the slope of the line) and other relative signal behaviours that occur in response to changes in workload or other internal and external factors can be more relevant than the specific value of the signals themselves.
We can also estimate the relative contribution or capacity of delivery vs extraction, which can suggest physiological limiters to performance and inform training prescription for an individual athlete.
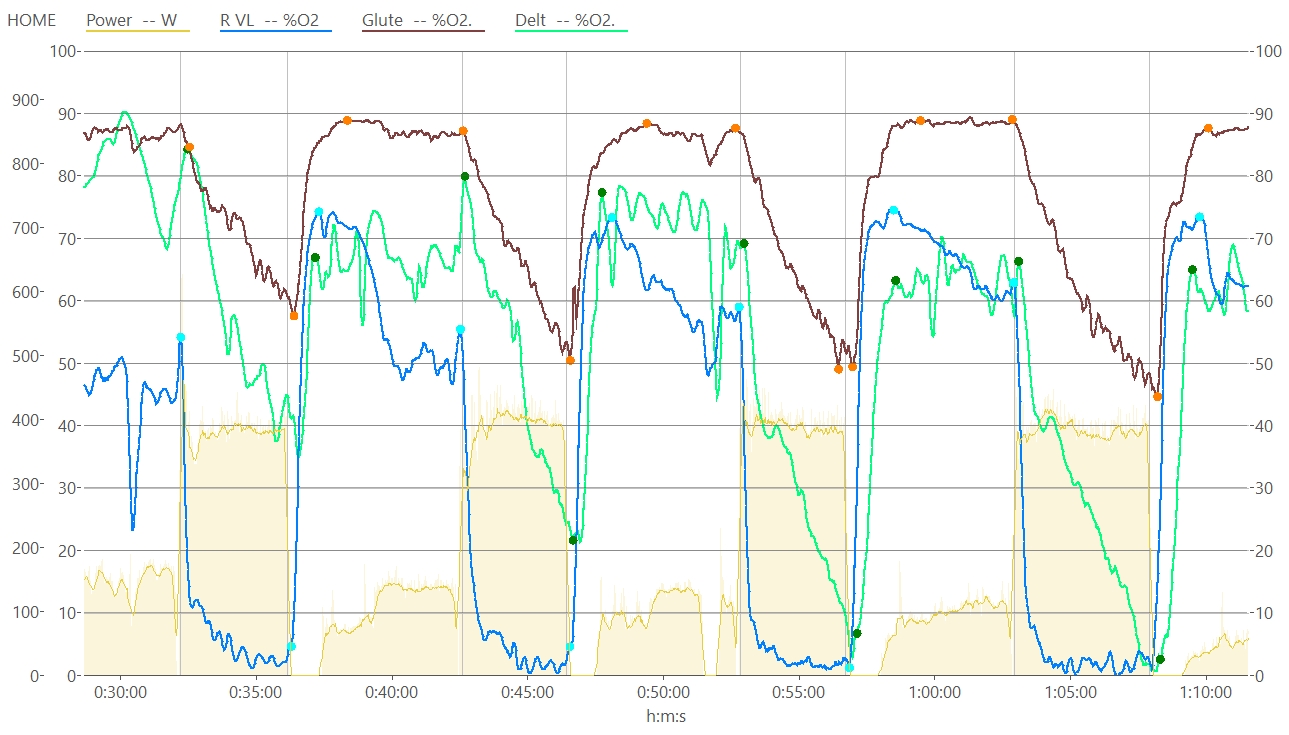
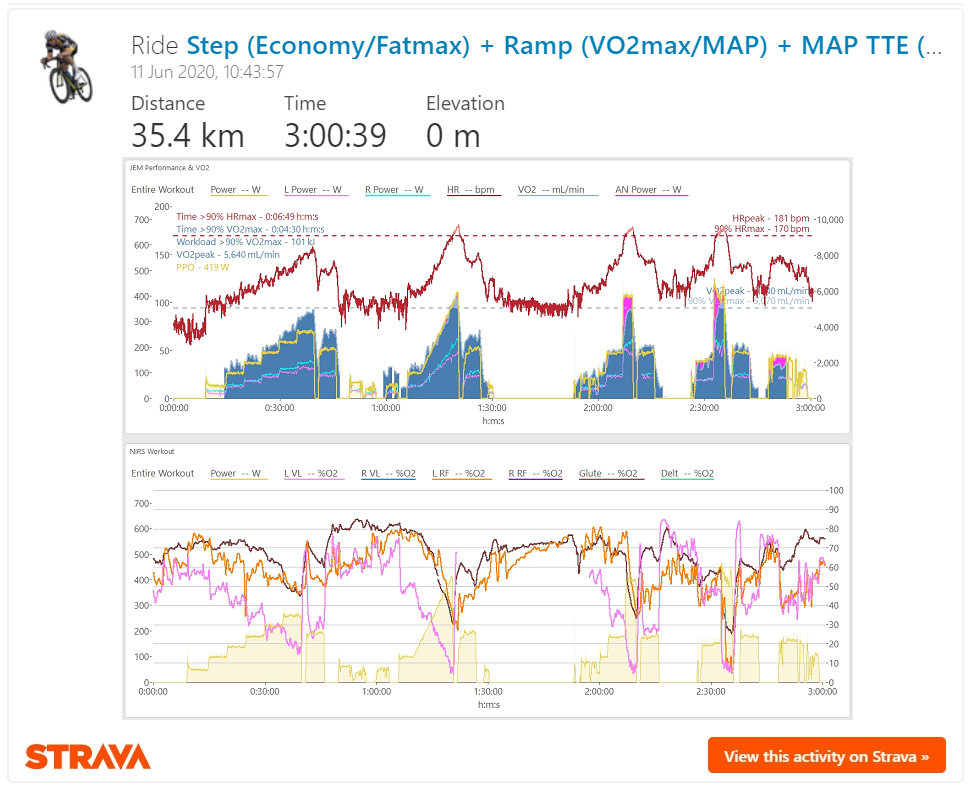
Chart of SmO2 measured at VL (blue), glute (brown), and deltoid (green) with min/max onset/recovery values (filled circles) used to interpret amplitude, slope, and other signal behaviours for each high intensity interval.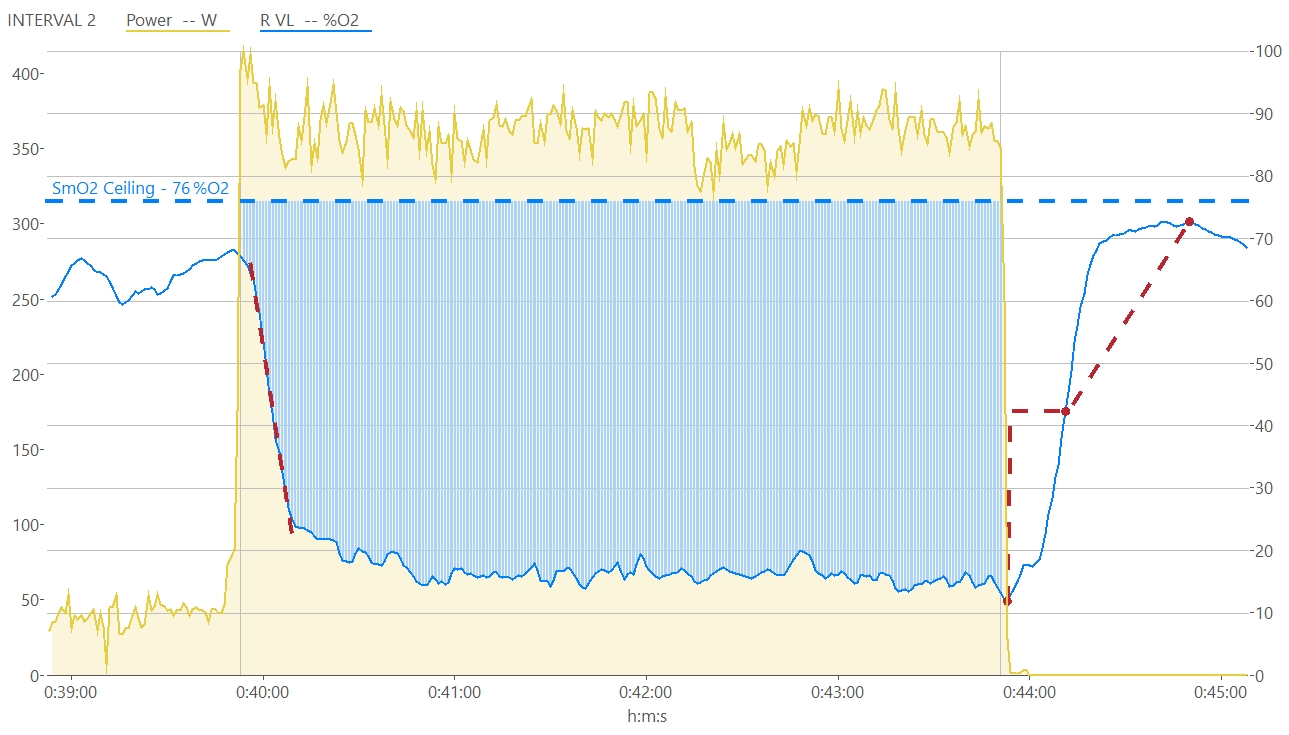
VL SmO2 profile during a single interval. The blue area represents ‘deoxygenation area‘, which I wrote about previously, which we think is related to the internal training load of the interval.
The red dotted line at the start marks the peak negative linear slope of SmO2 onset kinetics, which represents the point of greatest mismatch between O2 extraction and delivery. The red dotted line at the end shows half-recovery time (t1/2) and reflects the speed of SmO2 recovery kinetics.
I will have to go more into detail on the importance of these metrics another time, but these methods potentially contain information about local oxidative & glycolytic capacity, relative muscle fiber composition, and other intriguing markers of fitness
Calculated with custom expressions in WKO5
These principles potentially contain a lot of valuable information about the metabolic processes going on in the background during exercise. Let’s get into a bit more detail.
Physiological Implications of NIRS Signals
We’re gonna go a bit deep here into some of the more relevant interpretations of NIRS signals from the literature (sources at the top and throughout), as I understand them. There are some big implications here and I’m probably oversimplifying and overlooking some connections. Please check my work!
Deoxygenated Heme
• HHb is thought of as a proxy of fractional O2 extraction and reflects arterio-venous O2 difference (ie. the perfusive term Ca-vO2 in the Fick equation). Meaning HHb is most sensitive to metabolic activity within the muscle and least sensitive to blood volume changes.
For this reason HHb is most commonly used to derive the deoxygenation breakpoint (deoxy-BP) measured at the VL muscle during a ramp test. Deoxy-BP is more or less related to the second ventilatory breakpoint and FTP/CP/MLSS, allowing us to determine this approximate physiological threshold non-invasively using NIRS.
The mechanisms of this breakpoint are still being investigated, but it may be related to an attainment of a critical ‘metabolic milieu’ which elicits either an increase in local O2 delivery to match further increases in O2 extraction. Or the opposite: a local diffusive limitation between capillaries and muscle fibers which limits further O2 extraction (Azevedo, 2019). Clearly these are mutually exclusive interpretations, and I’m very interested to see how work on this subject progresses.
It also seems to me that VL reaching a relative oxidative limit (‘mV̇O2max’?) may elicit further power output from recruitment of other muscles. Including the other quadriceps muscles, gluteals, hamstrings, and importantly postural, stabilizer, respiratory, and other accessory muscles as the metabolic load is distributed across the whole body. This is an under-explored area in the literature and I have many thoughts on this topic, for another day!
Oxygenated Heme
• O2Hb is sensitive to O2 delivery and can reflect both changes in blood flow within the tissues under investigation (ie. previously mentioned re-distribution of blood between skin, fat, and muscle layers) and shifts of the oxygen-hemoglobin disassociation curve related to temperature, exercise, blood pH (ie. Bohr effect), etc.
A decline in O2Hb at higher intensities can be a sign of exercise-induced arterial hypoxemia, where a global shift in the O2Hb disassociation curve too far to the right (decreased Hb affinity for O2) can result in incomplete oxygen reloading at the lungs, meaning arterial O2 saturation (SpO2) is decreased and can limit systemic O2 delivery.
The recovery kinetics of O2Hb after exercise (as illustrated similarly above for SmO2) has been interpreted to reflect oxidative capacity as related to cytochrome oxidase activity and reconstitution of phosphocreatine (PCr); the fast source of energy for our muscles that also carries ATP (“energy storage” molecules) between mitochondria and contractile fibers (Bessman & Geiger, 1981; McCully et al, 1994; Sargeant, 2007; Hamaoka et al, 2011; Bhambhani et al, 2012).
Total Heme
• THb during exercise is sensitive to changes in hemoglobin volume (myoglobin volume does not significantly change during exercise) in response to both vasodilation (more blood volume under the sensor) and capillary hematocrit (higher concentration of Hb in that blood volume). This has been interpreted to reflect the diffusive term in Fick’s law of diffusion, such that higher THb reflects greater diffusive capacity, which in turn drives higher O2 uptake.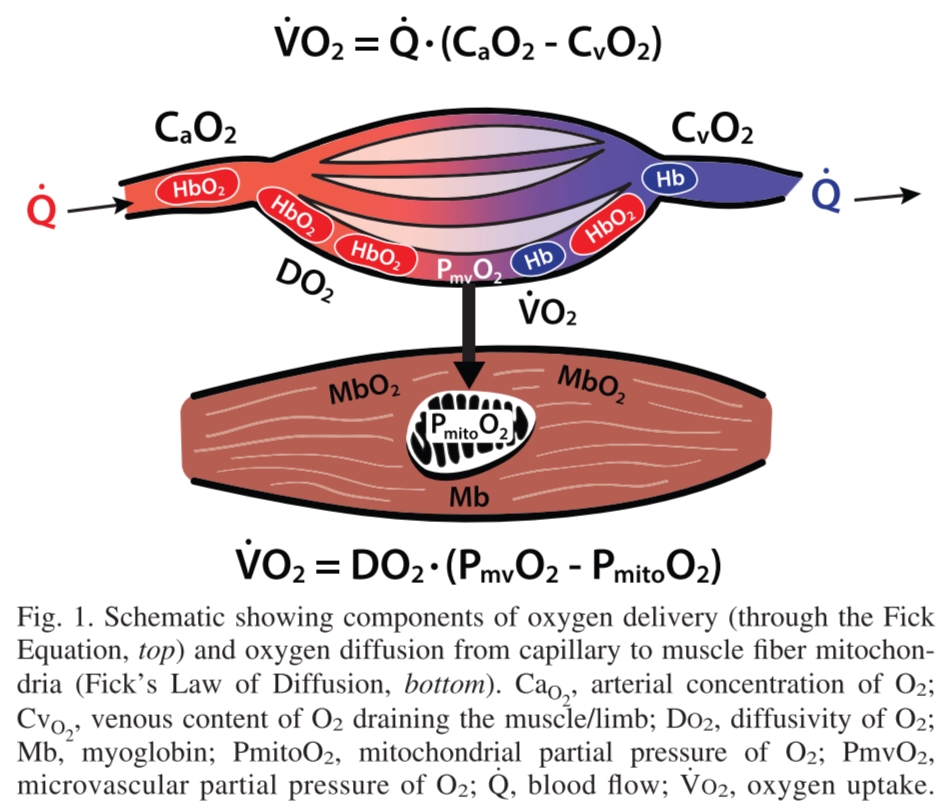
There are some fascinating implications of cadence on THb, that I don’t fully understand yet. Interactions between joint-specific muscle contribution, intra-muscular fiber recruitment speed, mechanical occlusion and contraction/relaxation duty cycle limiting convective O2 delivery, and even feed-forward effect of the peripheral muscle pump on venous return enhancing cardiac output and subsequent global O2 delivery. (Boone et al, 2015; Skovereng et al, 2016; Shastri et al, 2019; also see this presentation by Stuart Percival at SunSport Coaching).
There are tons of implications here I want to write more about. Consider this basically laying the groundwork and teasing some things I’m working on behind the scenes.
Topics include exploring how to integrate multi-site NIRS measurements for detection of thresholds and performance pacing. And also a look at how NIRS signals may give us more information into VLamax and some of the training principles recently popularized by INSCYD.
For example, how exactly is low cadence subthreshold training apparently decreasing VLamax? (Hint: maybe it’s more related to a between-muscle shift in recruitment strategy, more so than an actual structural adaptation within-muscle?). And can we estimate VLamax, glycolytic capacity, PCr burn rate, and fiber type composition all using NIRS? (Hint: Maybe? I’m working on it! :D)
It took me a lot longer than I expected just to write out this ‘brief’ overview of muscle oxygenation, as I re-read papers, reviewed my own data, and got sidetracked by new ideas. But of course that is the whole point of this writing exercise! To challenge my assumptions, synthesize my understanding, and articulate a narrative review to a diverse audience.
Please leave me a comment if any of the ideas I’ve teased strikes your interest. I have more work in the pipeline as things start to settle back into a ‘new normal’ IRL.
Reminder of the primary references for this article. Other references are scattered throughout, where relevant.
Boone et al, 2016. An Integrated View on the Oxygenation Responses to Incremental Exercise at the Brain, the Locomotor and Respiratory Muscles
Grassi & Quaresima, 2016. Near-infrared Spectroscopy and Skeletal Muscle Oxidative Function in Vivo in Health and Disease: A Review From an Exercise Physiology Perspective
Perrey & Ferrari, 2018. Muscle Oximetry in Sports Science: A Systematic Review
Barstow, 2019. Understanding Near Infrared Spectroscopy and Its Application to Skeletal Muscle Research
Hamaoka & McCully, 2019. Review of Early Development of Near-Infrared Spectroscopy and Recent Advancement of Studies on Muscle Oxygenation and Oxidative Metabolism

Jem, thank you for sharing your research. Would you say pulse oximeters (used on one’s finger) do or do not have application for cycling exercise analysis?
LikeLike
Hi Aidar. For anyone unfamiliar, pulse oximetry is a basic optical sensor technology that measures arterial O2 saturation (SpO2). You’ll likely have seen finger clip pulse oximeters used in the hospital and elsewhere. It’s very common in clinical settings, and it does have application in exercise research. But I don’t think it’s a relevant ‘at-home’ training tool.
SpO2 gives us a glimpse of the ‘a’ in Ca-vO2 – the arterial saturation in arterio-venous O2 difference. It tells us if there is a problem reloading O2 into the blood at the heart & lungs. Arterial hypoxaemia, as mentioned in the article, is properly assessed with SpO2. I should have added a comment about that. Pulse Ox is critical in altitude/hypoxia training where it can be used to monitor and ensure SpO2 doesn’t drop to risky levels.
Pulse Oximeters are super cheap, but outside of specific applications such as above, they won’t give you any relevant information to direct training, as far as I’m aware. For most athletes at sea level, SpO2 will be north of ~95% virtually at all times, even during maximal exertion. It can’t be used to detect intensity or assess performance. And the major problem I’ve found is simply the data quality is not sufficient during exercise, due to movement, sweat, elevated HR, elevated breathing, etc.
LikeLike
Thanks. Very informative.
LikeLike
Hi Jem
Can you see Whoop taking on this Tech?
I mean Whoop is an incredible device to follow our internal stress in training. And i love mine it is very dialed to how i feel and is pretty in sync with my Training Peaks tbh.
I also Coach and have been looking at Moxy just surprised there is not much else out there as of yet 5-7 years later.
Guess this is why im holding off on a purchase at the moment.
Nice write up too 🙂
LikeLike
Hi Mick,
I think Whoop and Moxy are trying to accomplish very different things with very different hardware and data processing, and more importantly they are presenting very different information to the user.
Whoop primarily wants to give the user information about longitudinal trends in systemic stress and recovery. Moxy primarily wants to give the user information about acute working muscle metabolic activity.
I don’t think these devices can be integrated into a single form factor. It would be like having your power meter also try to measure your heart rate from your crankset. And for either company to take on the tech of the other would be too far outside their core competency, in my opinion. Although I hope I’m proven wrong in the next 5+ years!
At least two other companies have attempted to produce a consumer-grade NIRS device in recent years, but both surprisingly failed. I don’t know why, but lucky for us Moxy has managed to find their niche as both a research and consumer product.
LikeLike
Thanks Jem
Great reading on your site should keep me entertained for a while .
Stay safe rubber down.
LikeLike
Thanks. That was helpful.
LikeLike
HI Jem,
as usual great content. I recently bought a moxy and collect more and more data.
I am interested in using the derived knowledge about my limiters for my training plan.
I did a 5-1-5 test and observed decreasing SmO2 and Thb values for high loads, indicating
a cardiac limitation. I should probably go for Vo2Max Intervals but are there any specific ones?
Question: What difference does it make to know if my limitation is pulmonary, cardiac or of oxidation capacity? I would guess that i would have to adress all three limitations with vo2Max intervals. But i would have done that anyway before buying a moy 😉
I searched through some studies to find specific interval types concerning cardiac output, but havent been succesful yet. Do you have any hints where to search?
LikeLike
Self answer: First starting points: https://my.moxymonitor.com/blog/how-to-train-an-athletes-limiter.
Also Philip Batterson, Moxy Monitor, Exercise Physiology, Training Limiters || Episode #119 – YouTube has some hints.
And working through the posts fo Jürg Feldmann, e.g. https://forum.moxymonitor.com/post/limitercomprnsators-7171362?pid=1285234144
LikeLike