Before my recent surgery I performed a whirlwind of self-testing to answer some pressing questions before being off the bike for a while. Now that I’m in recovery mode I’m working through all the data I collected and trying to write up the more interesting findings.
I was able to perform an informal pilot study with myself as the subject comparing the VO2 Master Pro against one of the standard metabolic carts we have at our lab, the Parvo Medics TrueOne 2400. The findings are very encouraging as to the validity of the VMPro as a novel lab- and field-ready VO2 analyser.
I hope this can provide at least a clinically relevant comparison of these devices for other researchers, clinicians, & coaches interested in investigating VO2 in everyday training environments.
I feel like I should add a disclaimer that I have consulted with VO2 Master – that is to say, I’ve pestered their experts with questions and provided feedback on my use of their device – but I’m not affiliated with them, nor have they solicited this comparison or provided any editorial input. They have seen the data I will be presenting below, but they will be reading this at the same time as everyone else

I performed probably close to a dozen traditional ramp and step tests in the months while I was waiting for surgery. I previously showed some interesting comparisons of how different ramp rates and test durations affect the VO2-Power relationship. Now let’s look at the same ramp protocol repeated with different devices.
Ramp Incremental Tests
Let’s be precise starting with our Methods section. I performed three ramp incremental cycling tests over the course of 6 weeks at the end of summer 2019. The ramp protocol was 5min at 100 W followed by an increase of 30 W/min (1 W every 2sec) until task failure. I maintained a self-selected cadence during the test and task failure was reached when I was no longer able to maintain within 10 rpm of the chosen cadence.
The tests were run using the software PerfPro Studio. This software also displays real-time data during the tests. All tests were performed on my own bike set up on a Wahoo Kickr trainer. The Kickr was controlled by my 4iiii dual-sided power meter. All power data come from this power meter. Heart rate was recorded with 4iiii Viiiiva HR monitor. NIRS data (SmO2 and tHb) were recorded with 4x Moxy Muscle Oxygen Monitor sensors positioned at both right & left quads (VL), R glute, and R deltoid muscle bellies. These non-priority/non-locomotive sensors will be important later on for identifying physiological breakpoints.
The first of three ramp trials (identified as VMPro) recorded oxygen consumption and ventilation parameters with the VO2 Master Pro analyser. The latter two trials (identified as TrueOne RP2 and TrueOne RP3) were recorded with the Parvo Medics TrueOne 2400. All data processing was done in TrainingPeaks WKO5. VO2 and other ventilation metrics were smoothed to 30sec. VO2peak was defined as the highest 30sec VO2 data, rounded to the nearest 10 mL/min. Power and SmO2 data presented below were smoothed to 15sec. Peak Power Output (PPO) was defined as the highest 15sec power data.
I’ve visualized the three trials overlapping with both the start and the end of the ramp test time-aligned at the vertical bars. However the three trials were each slightly different durations.
- VMPro: 11:38
- TrueOne RP2: 11:28
- TrueOne RP3: 11:10

- Range of PPO: 421-434 W
- I may have had minor fitness changes over the course of the 6-weeks, but I was in ‘maintenance training’ at most during this period. Peak Power as a performance measure are very similar between trials, suggesting underlying physiological measures should also be similar.
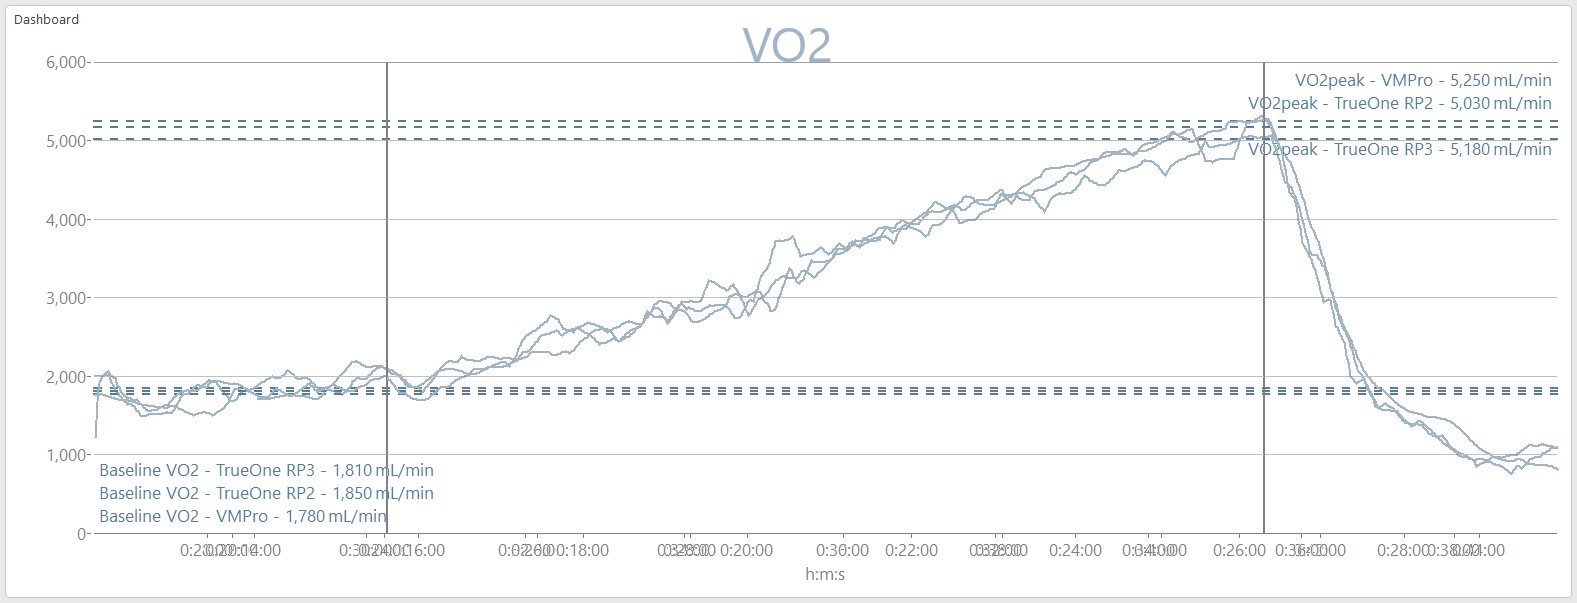
- Range of VO2peak: 5030 – 5250 L/min (62.9 – 65.6 mL/kg/min at 80kg bodyweight)
- VO2peak show a very tight range and correlate the minor differences in PPO shown above
- One limitation in the design of the VO2 Master is the ‘user piece’. This is a swappable hardware piece through which you exhale and inhale. It controls the volume or rate of air flow through the mask and into the O2 sensor. There are a few sizes (eg. Medium, Large) that are optimized for different volumes of ventilation. I was using the Large user piece which is designed for 40-220 L/min. At the lowest intensity I’m probably breathing less than 40 L/min so readings from the VMPro at Baseline may be less accurate. All this to explain why the VO2 measured at Baseline is slightly lower for the VMPro trial.
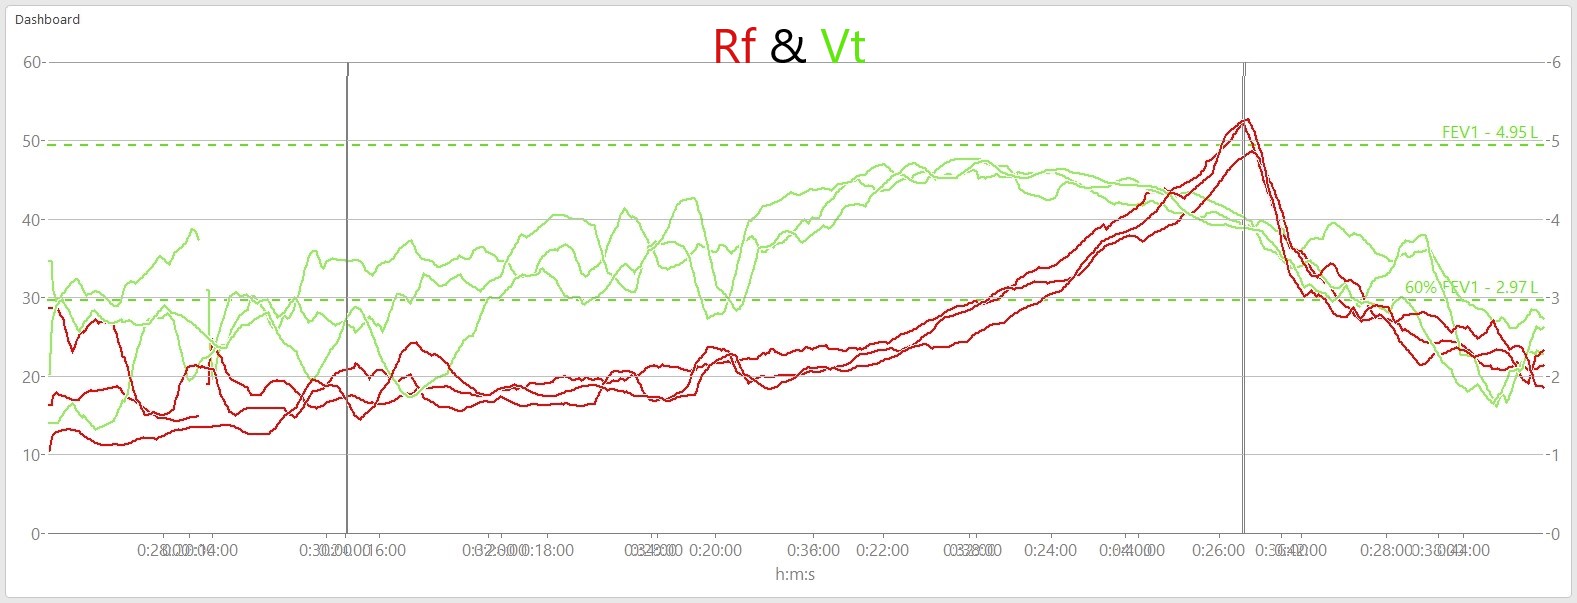
- Respiratory Frequency (Rf) and Tidal Volume (Vt): how quickly I was breathing, and the depth of each breath
- Range of peak Rf: 49 – 53 brpm
- Range of peak Vt: 4.6 – 4.8 L
- Dotted green lines show my spirometry-tested FEV1 (4.95 L) as a theoretical max Vt, or max depth per breath and 60% of FEV1 (2.97 L) as an ‘ideal range’ for efficient gas exchange. This was inspired from Daniel Crumback’s work with performance assessments using NIRS and VO2.
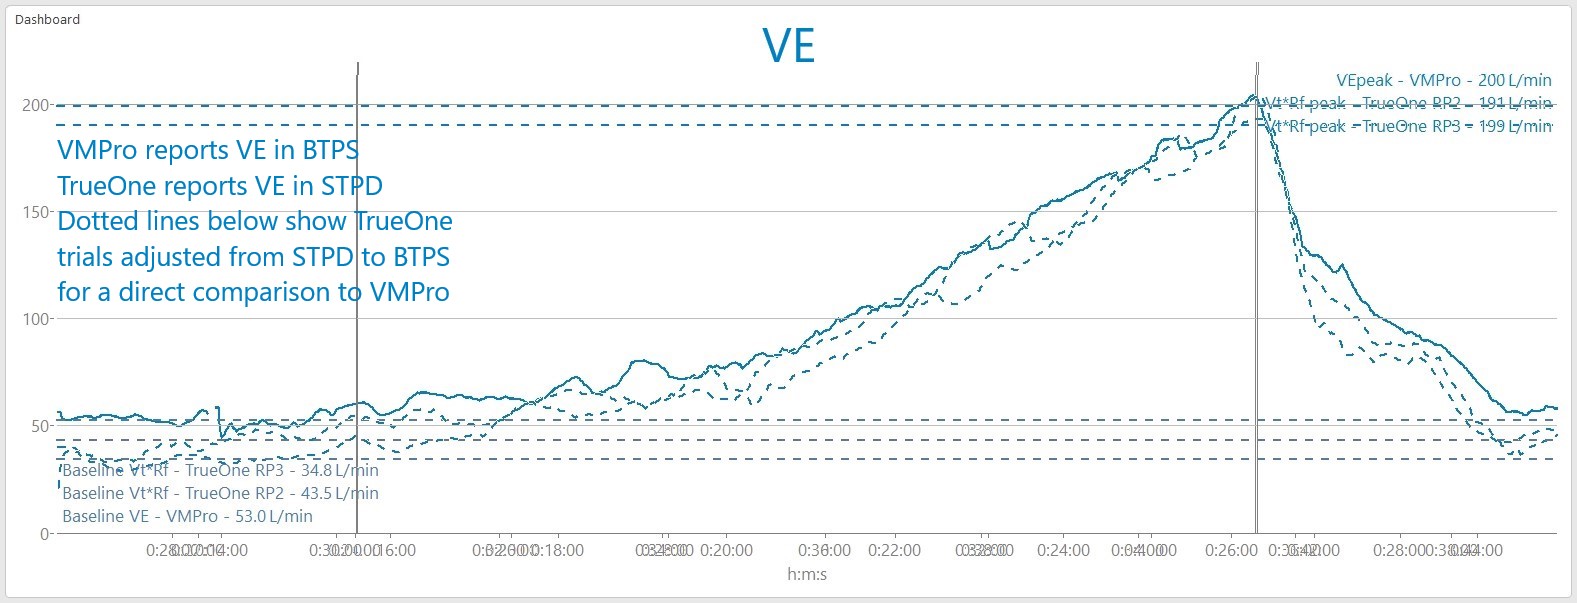
- Minute Ventilation (VE): the volume of gas exchange per minute
- Range of VEpeak: 191-200 L/min
- The VO2 Master and TrueOne record VE with slightly different settings. I didn’t realize this until after all the data were collected. So to directly compare between the devices I simply multiplied Rf * Vt (rate * depth) to show a fair comparison of VE. Later I was able to compare the raw data using the same settings and confirmed both devices matched to the calculations shown here.
- Remember the limitation of the VMPro Large ‘user piece’ under 40 L/min? Although avg VE looks like it’s hovering around 50 L/min, this chart actually omits zeros, and any VE below 40 L/min would have been recorded as zero. So the actual VE at baseline would have been lower and more in line with the TrueOne trials.
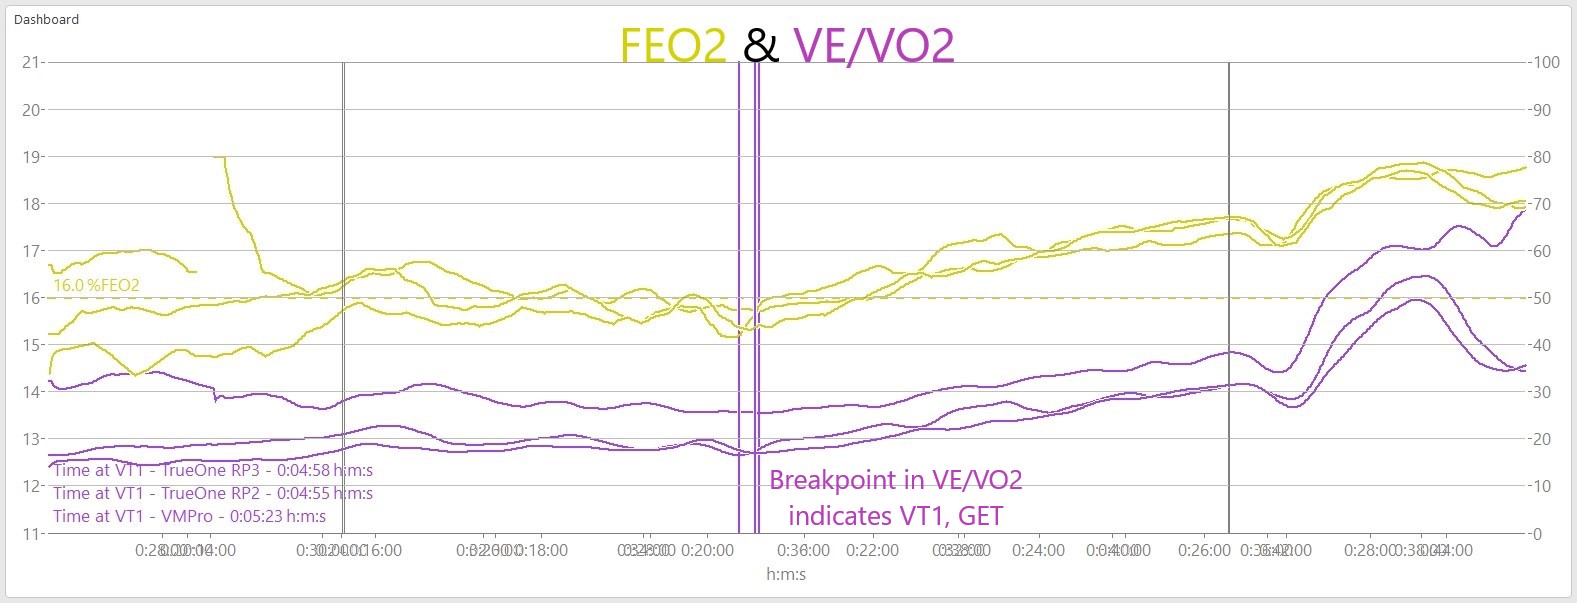
- Fraction of Expired Oxygen (FEO2) is the leftover O2 expired that isn’t taken up at the lungs for gas exchange.
- VE/VO2 is the ratio of ventilation to oxygen consumption. This ratio is used to determine the first ventilatory breakpoint (VT1 or Gas Exchange Threshold: GET).
- Vertical purple lines indicate this ventilatory breakpoint in VE/VO2. Time at VT1 (bottom left) reflects duration from the beginning of the ramp test to attainment of this first ventilatory threshold.
- The dotted yellow line at 16% FEO2 is another recommendation from Daniel Crumback for ‘efficient aerobic gas exchange’. Ambient air is 21% O2, meaning a lower FEO2 implies greater uptake of oxygen. At lower intensities FEO2 below 16% is a good sign that the respiratory system is efficiently taking up oxygen. At higher intensities for various reasons FEO2 will inevitably increase. But I have seen well-trained athletes maintain ~16% until very near their VO2max.
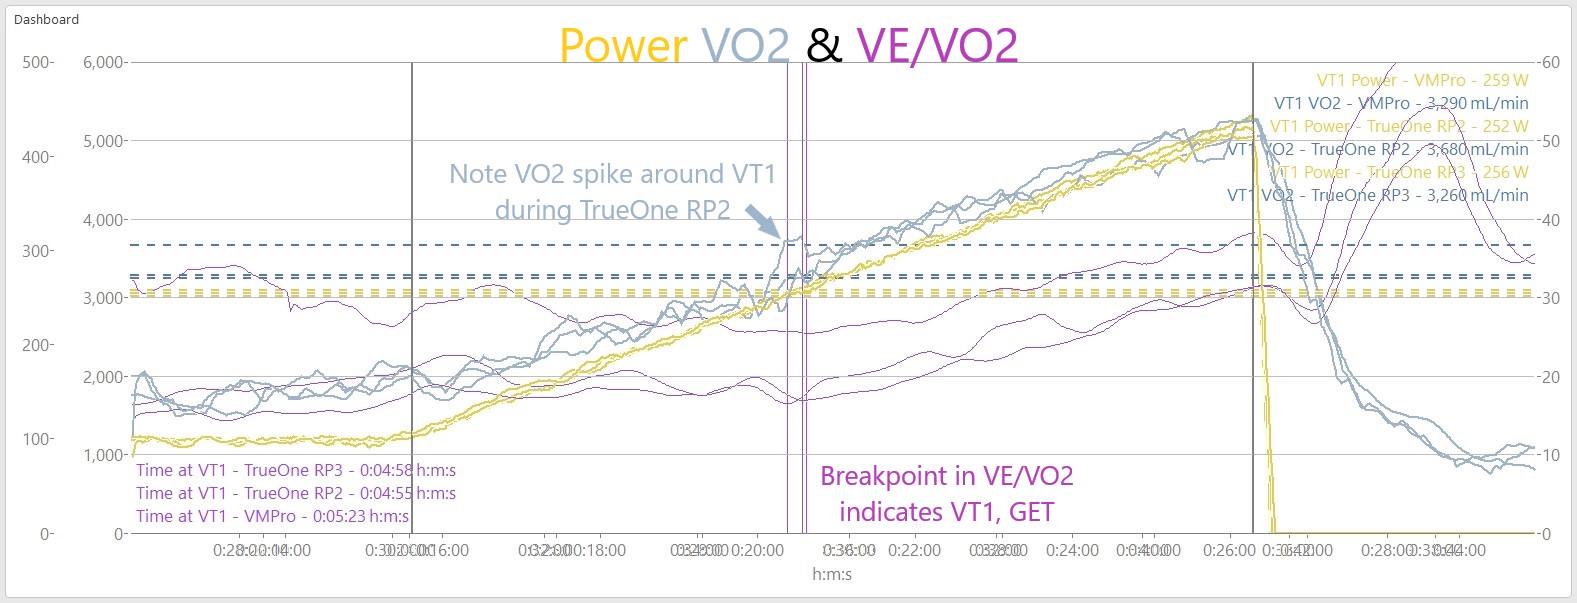
- Range of Power at VT1: 252 – 259 W (59 – 61% PPO)
- Range of VO2 at VT1: 3260 – 3680* mL/min (63 – 73%* VO2peak)
- *Note the brief spike in VO2 during the TrueOne RP2 trial, which bumped up the VO2 at this point.
- Also note: VO2 is not left-shifted to account for the mean response time between power output at the legs, and systemic ventilatory response at the lungs. MRT-shifted VO2 at this point will be slightly higher than presented here.
- This is a similar chart as above, omitting FEO2 and including Power and VO2 at the VT1/GET breakpoint in the top right corner.
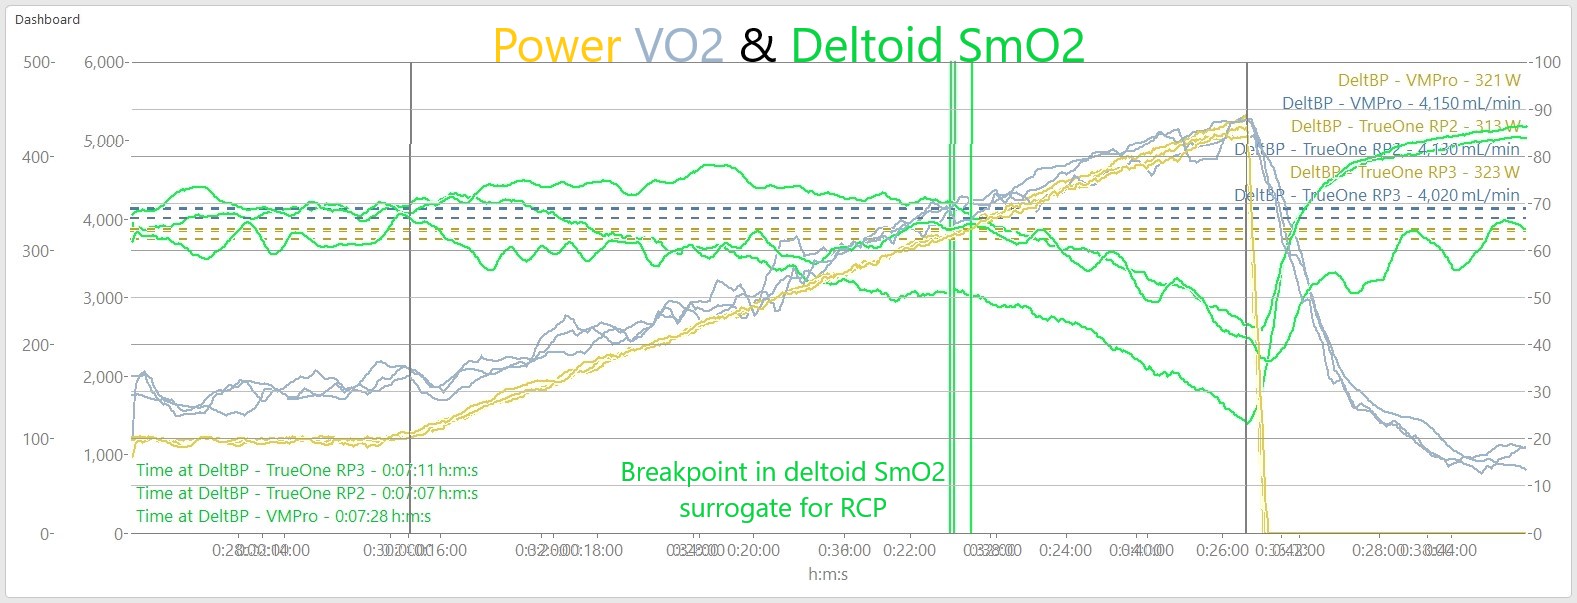
- Muscle Oxygen Saturation (SmO2) measured at the deltoid (shoulder) muscle using Moxy Muscle Oxygen monitor.
- Range of Power at deltoid-breakpoint: 313 – 323 W (74 – 77% PPO)
- Range of VO2 at deltoid-bp: 4020 – 4150 mL/min (78 – 82% VO2peak)
- Note: VO2 is not left-shifted to account for mean response time. MRT-shifted VO2 at this point will be slightly higher.
- This chart shows SmO2 (green) from the Moxy sensor positioned on the deltoid (non-priority/ non-locomotive muscle) on top of Power and VO2. In our ongoing research we have found a reliable breakpoint in non-priority muscle deoxygenation around the Respiratory Compensation Point (RCP) or second Ventilatory Threshold (VT2). The appearance of a deoxygenation breakpoint in NIRS-derived values (eg. SmO2 in this chart) is thought to be related to Critical Power, Maximum Lactate Steady State, or FTP. This is a fascinating subject that we’re continuing to research.
- The vertical green line is positioned at this deltoid-breakpoint for each trial and shows Power & VO2 at this breakpoint.
Conclusions
I actually want to avoid drawing too many conclusions about the validity of the VO2 Master Pro compared to the TrueOne 2400. That will require more trials, better stats, and more controlled conditions. This comparison, as the euphemism goes, has “high ecological validity”. ie. although poorly controlled and statistically underpowered, this provides a realistic perspective on potential everyday use of the device in training.
What I will say for now is that the visual comparison between devices presented here is promising. Certainly any differences appear to be within expected intra-individual variability over this low number of trials.
I will have a few more direct comparisons coming up POSTED between these VO2 devices, and we will be gathering more direct comparisons with other athletes through the winter.

Thankk you for sharing this
LikeLike