I recently showed some modelling I’m doing with muscle oxygenation from various muscle locations, including some interesting novel findings from the lumbar erector spinae (paraspinal) muscles. I have been digging more into the paraspinals signals with Moxy, and whether they can be used to predict cycling time to exhaustion (TTE) at a constant power output.
We are seeing the paraspinals location reach ‘zero’ oxygen saturation (SmO2 %) surprisingly consistently, across the female and male subjects we have tested so far. (see the last section, below for a discussion of what ‘zero’ oxygen saturation even means). Even when the primary locomotor muscles such as the vastus lateralis (VL), do not reach near absolute zero, the paraspinal often do. And they often reach near zero at task intolerance, such as in the example below, with two trials from the same subject:
Two trials from the same subject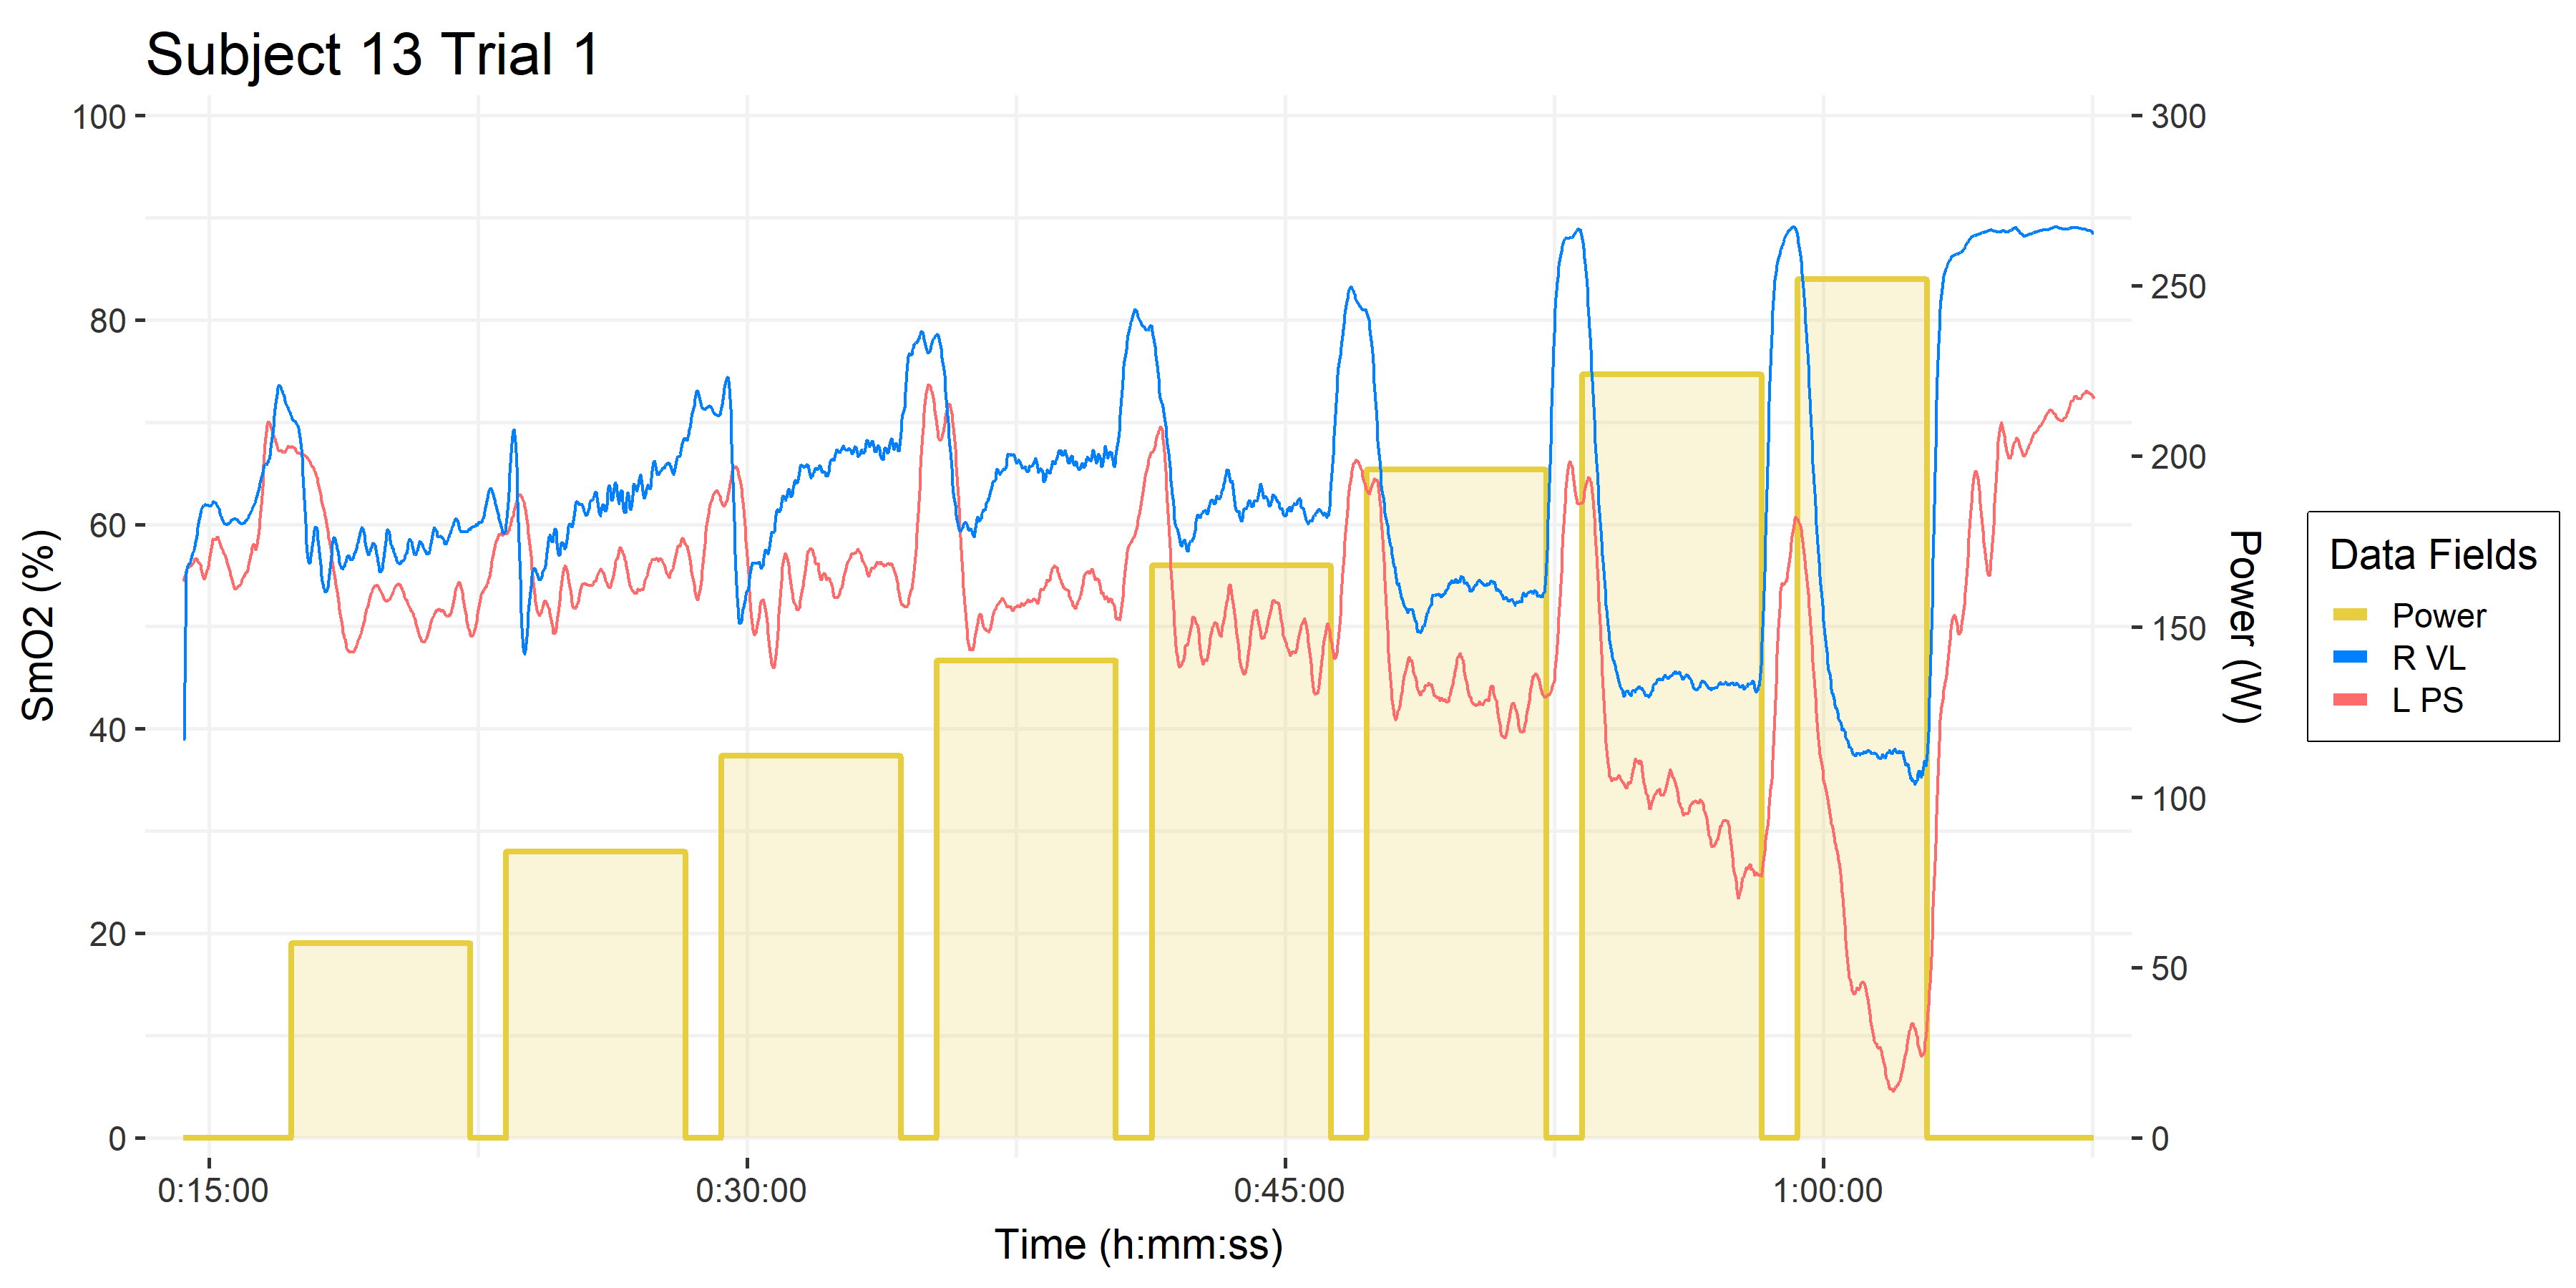
• 5-1 intermittent multi-stage cycling test: 5-minute work stages, 1-minute rests.
• Time on the x-axis.
• Power (W ) on the right y-axis, and in gold blocks.
• Muscle oxygen saturation (SmO2 %) on the left y-axis.
• Right Vastus lateralis (R VL) SmO2 in blue. This is the primary locomotor muscle involved in cycling and most of the NIRS literature is on this muscle.
• Left Paraspinals (L PS) in orangered, which are postural stabilizers. There is some literature using NIRS on the erector spinae in the clinical back pain literature, but I have not yet encountered it’s use in cycling.
• Not pictured are all the rest of the data channels from Moxy sensors, gas exchange parameters, blood lactate, etc. which I compared in my last article.
Extrapolating Linear Deoxygenation Slope
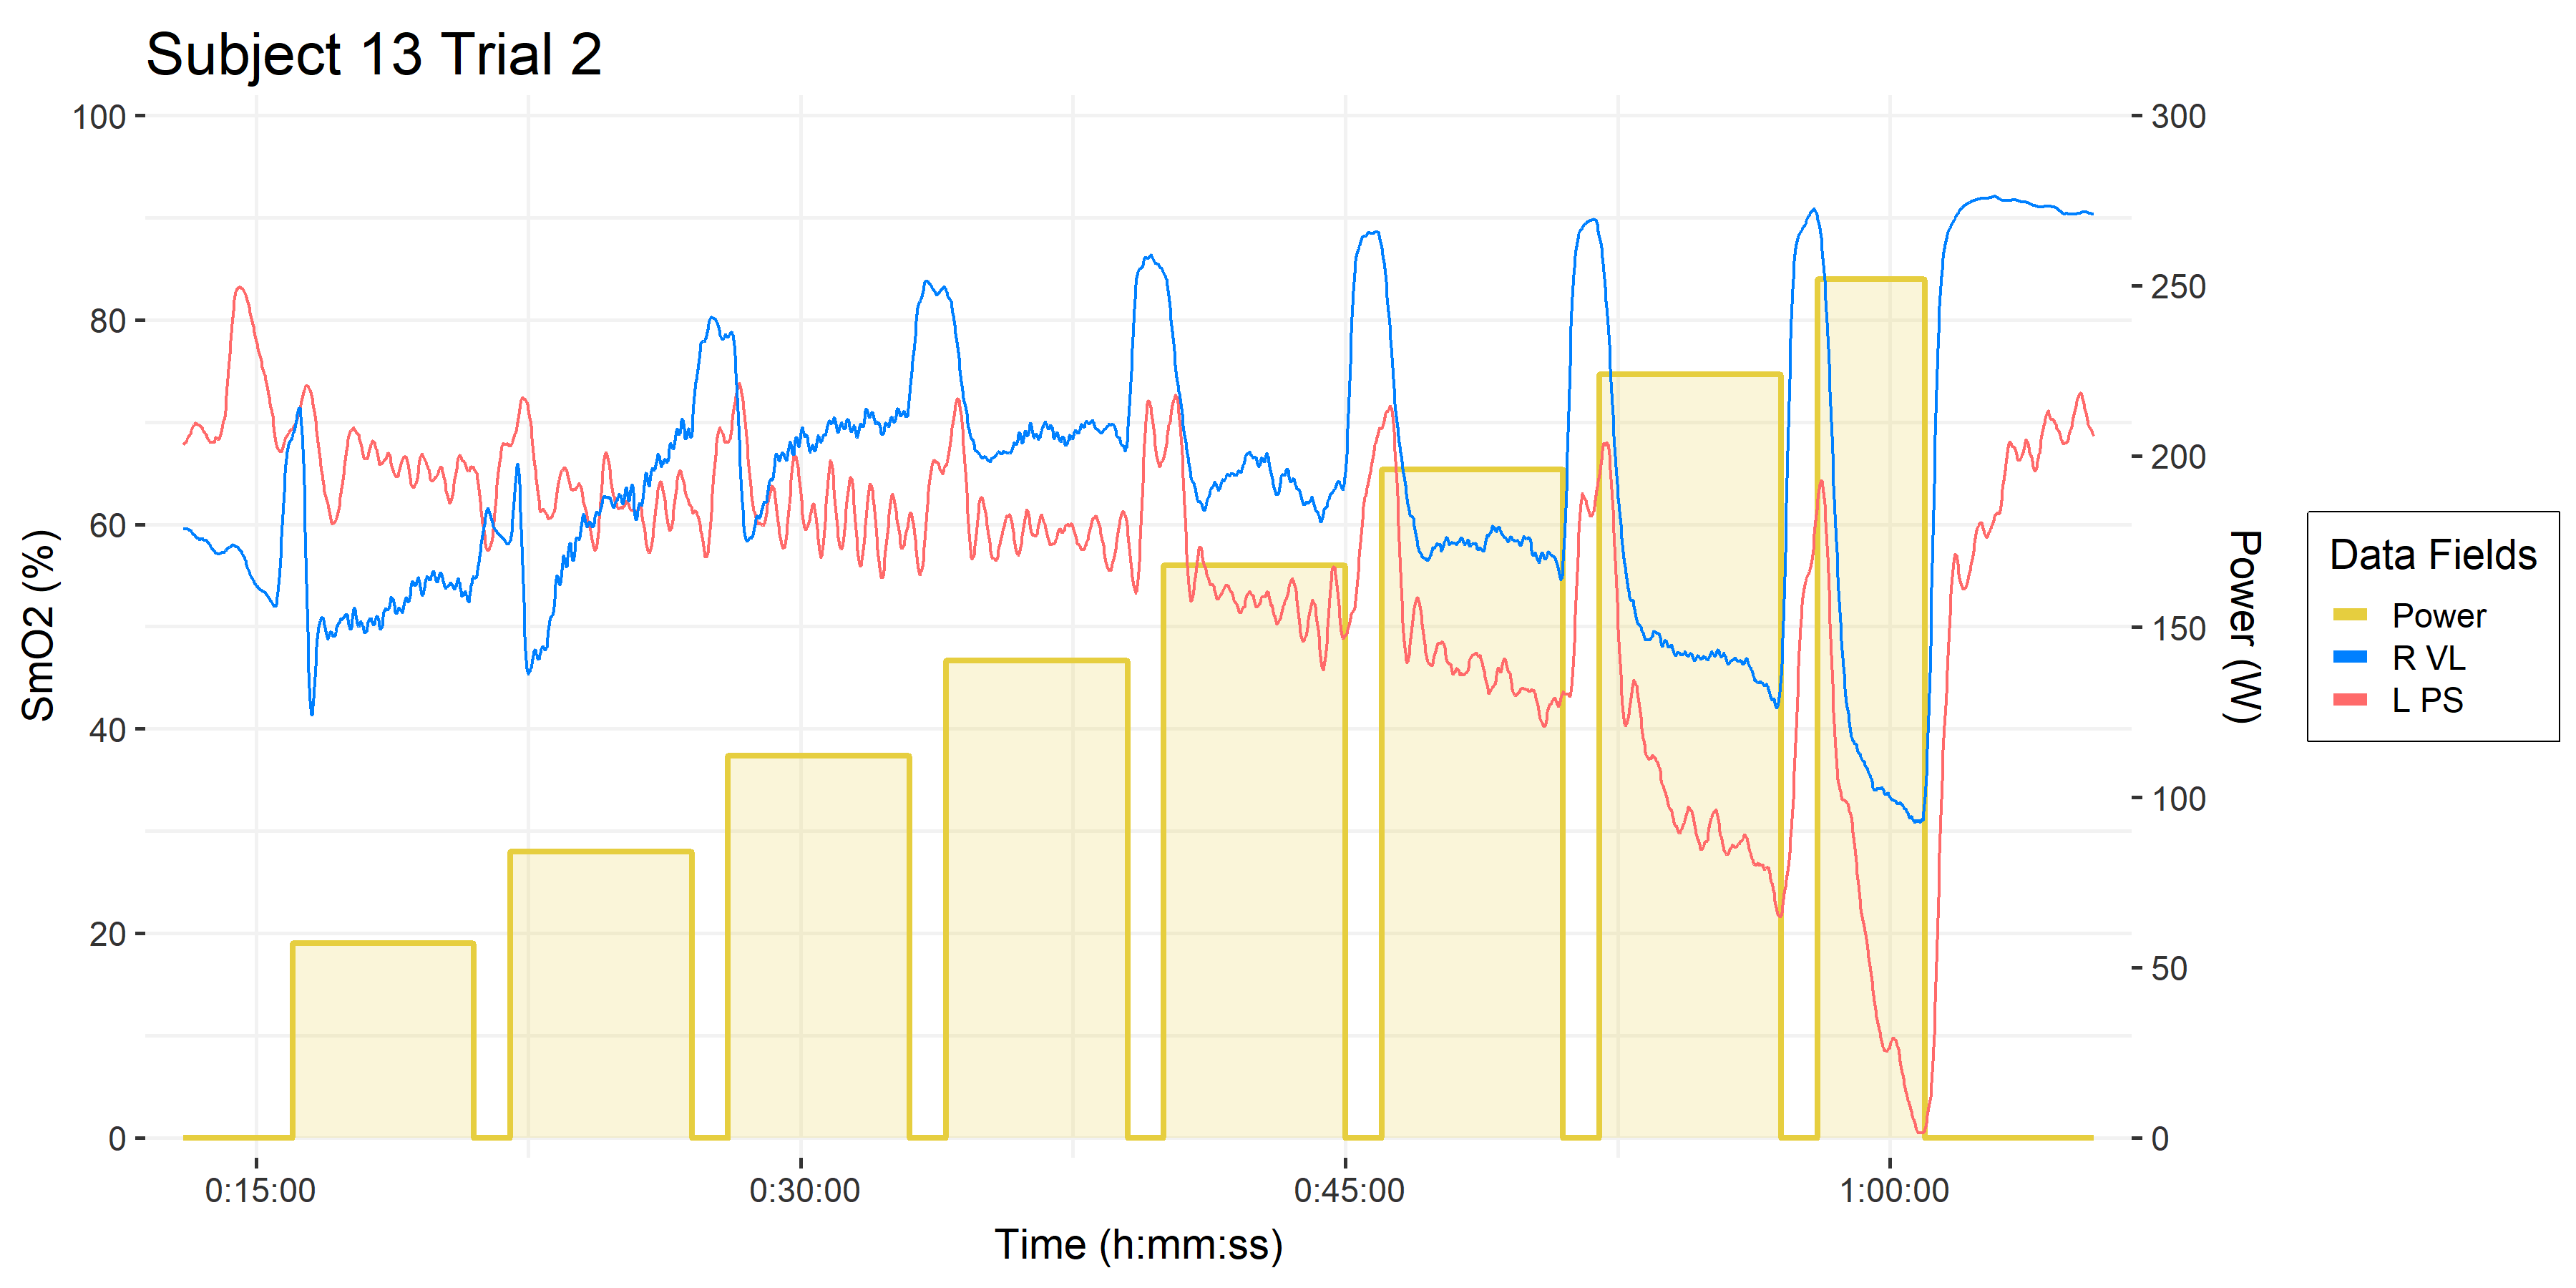
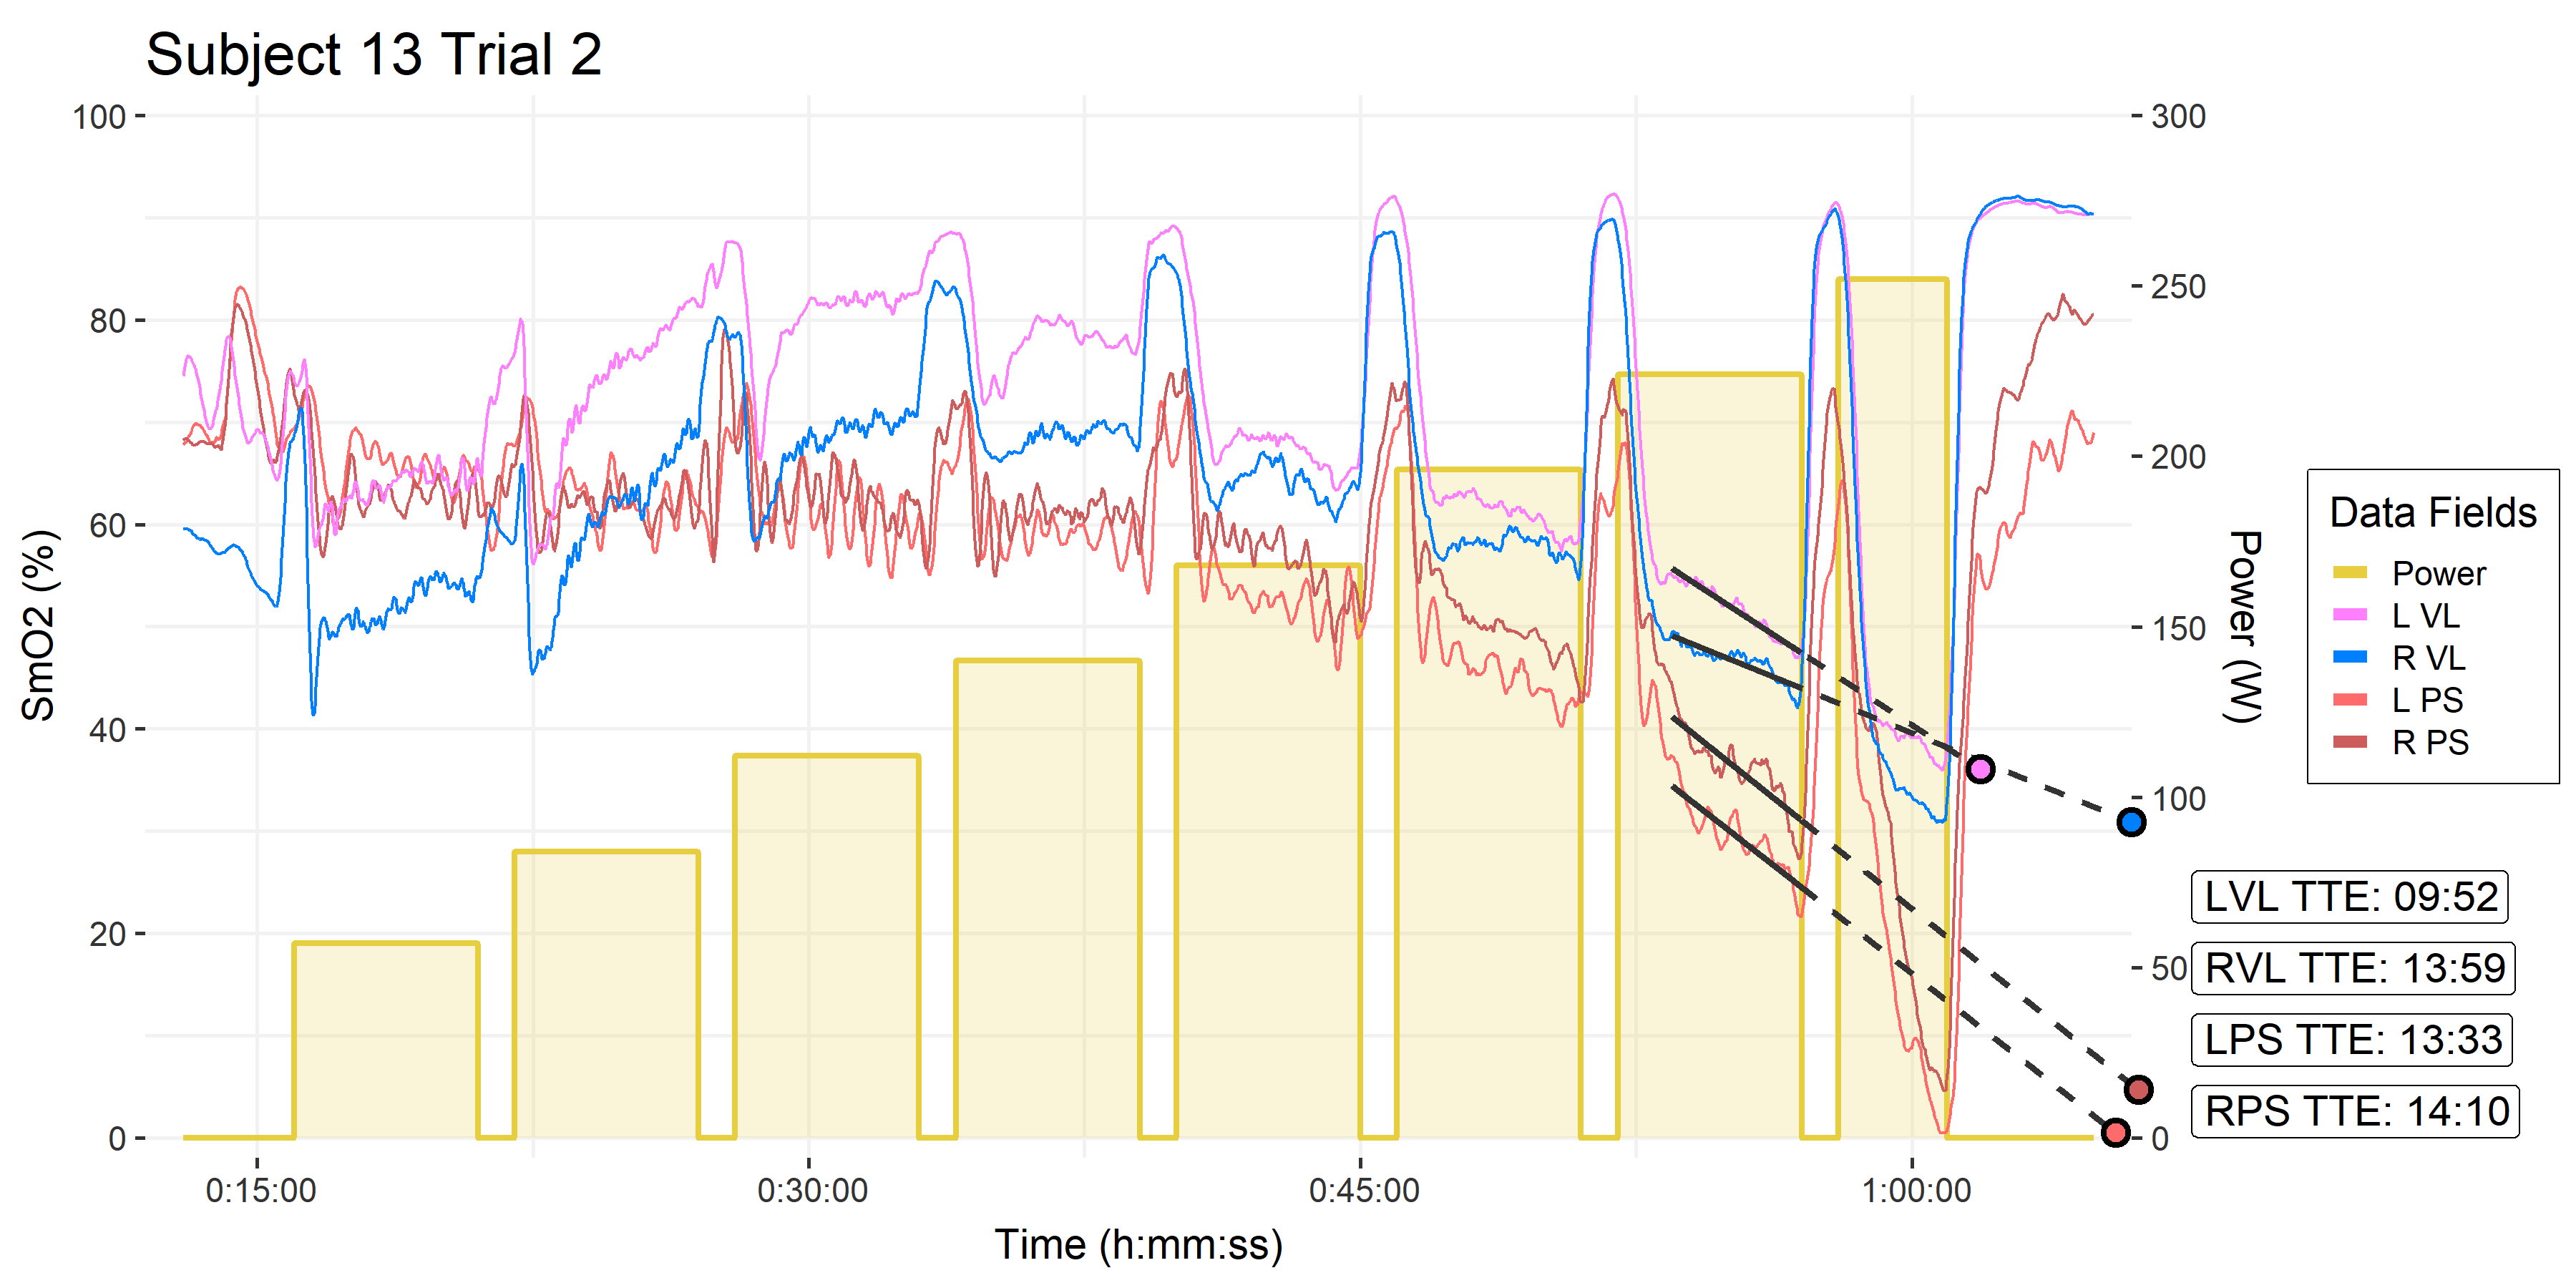
From the PS SmO2 signal we are observing during the 5-1 assessments, we speculate that the linear slope of deoxygenation could be predictive of time to exhaustion (TTE) if the workload were continued to task intolerance. Something like this:

• Trial 2, from above.
• Black solid line is the linear slope fit to the left PS SmO2 during the second last work stage. The first 90-seconds of the stage are omitted as onset kinetics.
• The dashed line is the extrapolation of that linear fit, to the minimum SmO2 value observed during the trial, which in this case was near absolute zero.
Our hypothesis would be that the linear extrapolation of PS SmO2 during the work stage can predict time to exhaustion, when performed to task intolerance. In this case the prediction is 13:33 at 225 W. Out of interest, the other trial this subject performed predicts a TTE of 11:36 when extrapolated to the slightly higher minimum saturation value attained in that trial. And TTE of 13:01 to the same near-zero value as this trial pictured above. So we have two reasonably consistent estimations of TTE at that workload.
The experiment I will be doing to follow up on this hypothesis is getting these subjects to perform a TTE task at the one of the workloads that they performed in the assessment, starting fresh from a fully warmed-up state (we’ll see the importance of a proper warm-up below). Again, our hypothesis is that the linear slope of PS SmO2 from their assessment will accurately predict their TTE during the constant workload TTE trial.
In the meantime, we have done some additional piloting that might suggest the relationship is a bit more complicated that just linear slope.
Pilot Testing Preliminary Results
Another colleague is currently pilot testing a series of cycling intervals for a different study. I decided to throw some Moxys on his VL and PS. The first session he performed was a 10-minute interval at constant workload of 350 W, which is in his severe intensity domain, just above his Critical Power. Followed by a short incremental ramp test to task intolerance.
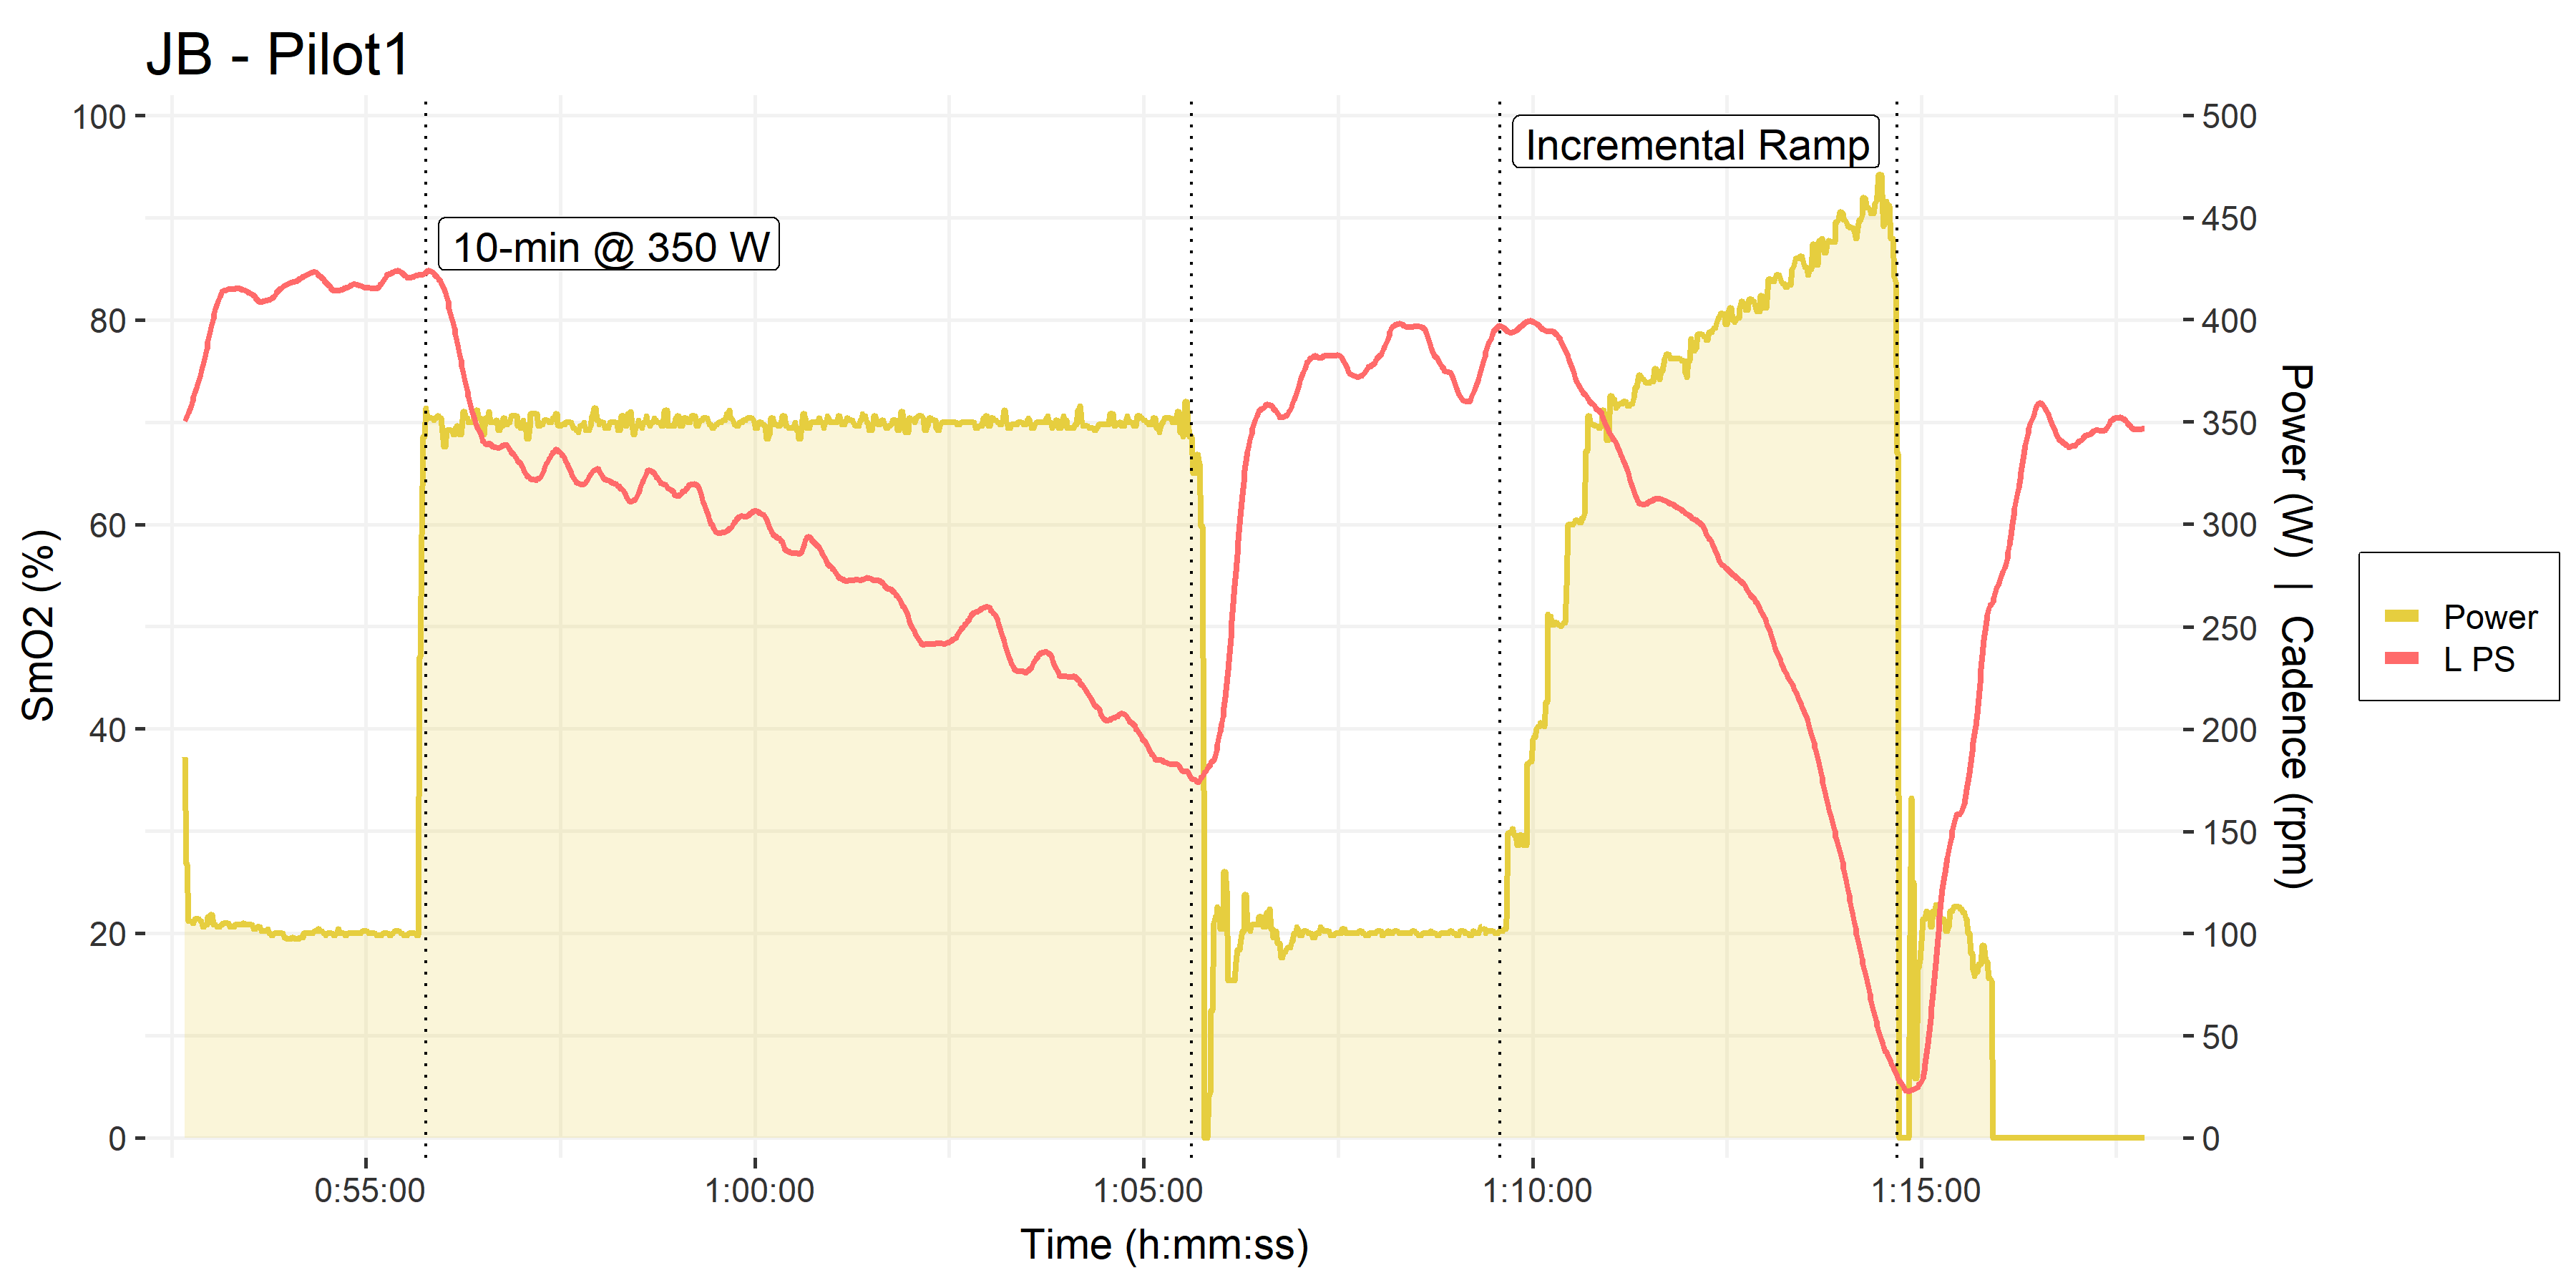
• Submaximal graded step test as warm-up, not shown.
• 10-minutes at 350 W and Incremental ramp test restarting from 350 W, labeled.
• PS SmO2 shown in orangered.
To be clear, this is now a different individual from the 5-1 assessment trials pictured above.
From the 10-minute constant workload interval, we could see that the PS appears to show a curvilinear deoxygenation profile, rather than the apparently linear slope we observed in the 5-minute stages of the 5-1 assessments. So I fit a quadratic polynomial through the PS SmO2 data and extrapolated that to the minimum SmO2 value that he attained during the subsequent incremental ramp test.

• Same as above
• Solid black polynomial fit to the PS SmO2 during the 10-minute interval (omitting 90-sec onset kinetics)
• Dashed black line extrapolated to the minimum SmO2 value attained during the subsequent incremental ramp test.
This curvilinear deoxygenation model gave us a predicted TTE of 14:52, assuming he would be able to reach the same minimum saturation as during the incremental ramp test, which was around 5%.
At our next opportunity, he performed a time to exhaustion task at the same 350 W to test this prediction model. However, as we’ll see in a moment, he did not perform a warm-up, and we saw some obvious differences in the PS deoxygenation response profile.
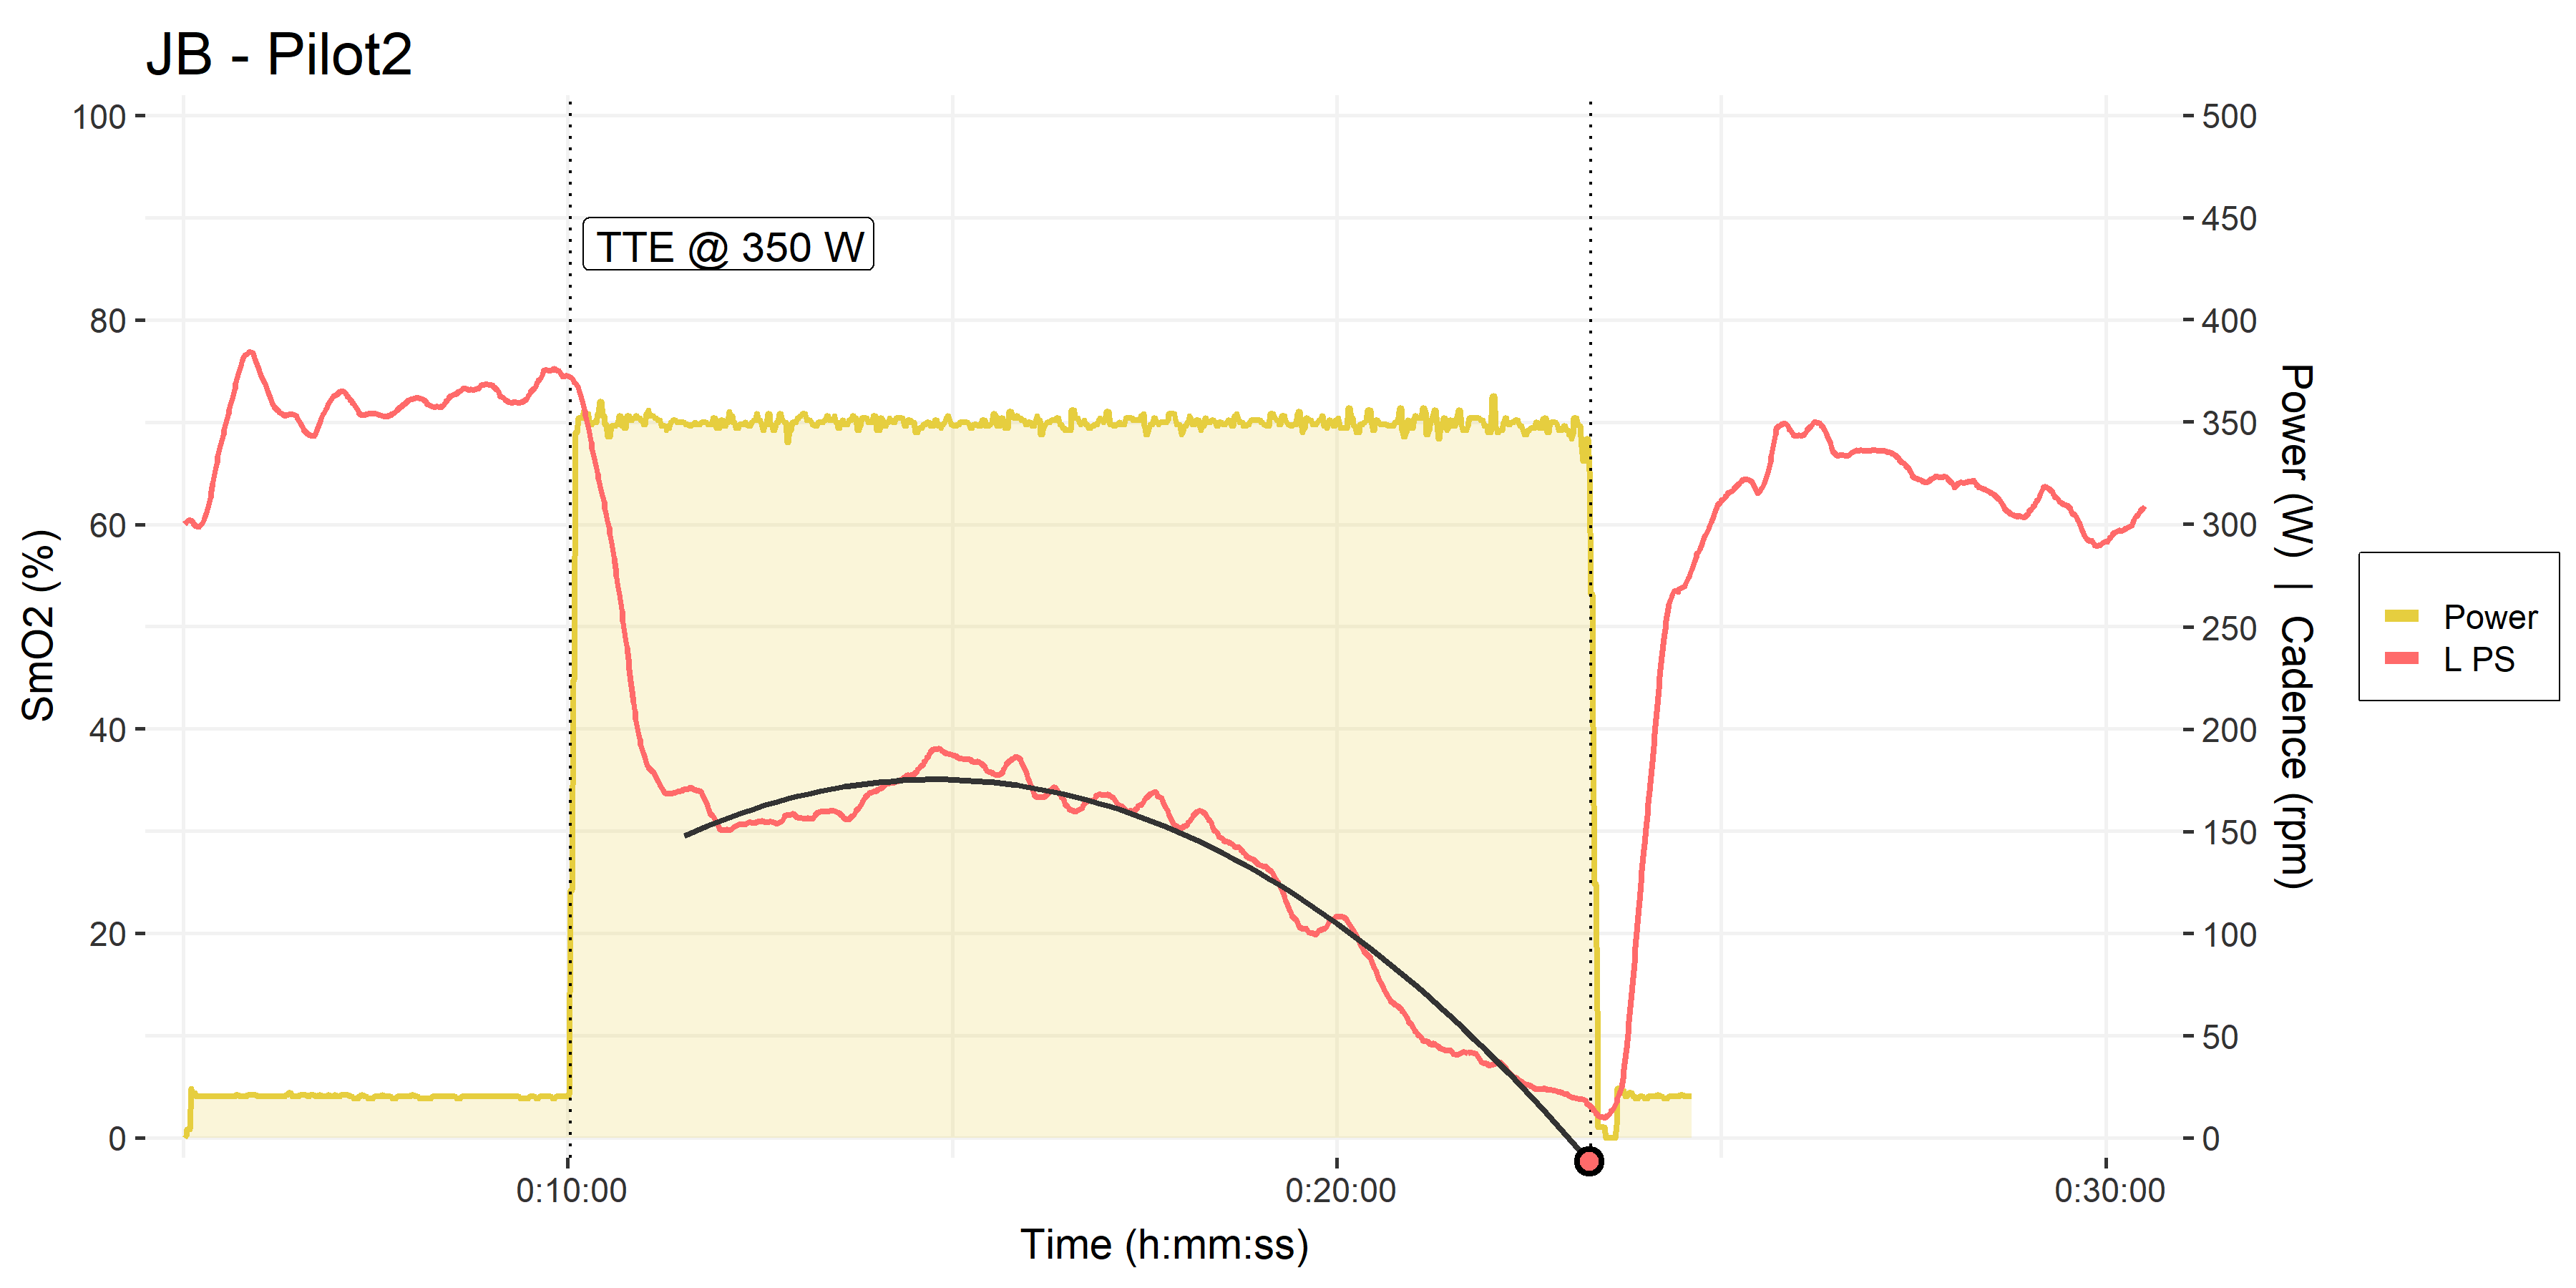
• Pilot trial #2, time to exhaustion at 350 W.
• Solid black polynomial fit to the PS SmO2 during the TTE trial (omitting 90-sec onset kinetics). This simple curvilinear model doesn’t quite capture the true non-monotonic response.
Note the difference in the initial onset kinetics of PS SmO2 at the start of the 350 W intervals: In his first trial he had already performed ~30-minutes of submaximal exercise, meaning he was sufficiently warmed-up and ‘primed’ before the 350 W interval. He started from ~85% SmO2 and initially dropped to only ~70% at the start of the 350 W interval. Deoxygenation throughout the 10-minute interval was monotonic.
In this second trial however, as soon as the workload was applied he dropped from ~75% down to nearly 30%, then displayed some re-saturation during the first 5-minutes before resuming a monotonic deoxygenation for the remainder of the interval.
I’ll have to dig into the complexities of warm-up/priming effect on blood flow, perfusion, and deoxygenation onset kinetics another time. For now, let’s stick to testing our hypothesis about TTE prediction.
Clearly, the PS deoxygenation profile looks different, but how was his empirical TTE relative to the prediction of ~15-minutes?

• Pilot trial #2, time to exhaustion at 350 W, as above.
• Empirical polynomial model fitted to the PS SmO2 data, and an empirical TTE of 13:15.
• The prediction model from his previous 10-minute interval is shown for reference, with a predicted TTE of 14:52.
He reached just over 13-minutes in this TTE attempt, which is at least in the neighbourhood of the ~15-minute predicted TTE. And I’ve already mentioned that I think an insufficient warm-up may have accounted for at least some of that time difference.
Later in the week we programmed a better warm-up, and he gave it another shot. Of course, we were not un-biased at this point. We knew what his target TTE was, and we both wanted to see him reach ~15-minutes. So please keep in mind this is completely biased in favour of seeing the response we wanted to see. He was blinded from seeing time or SmO2 during the exercise trials themselves, but he was familiarized with the TTE protocol at this point. And we were giving him strong encouragement throughout the trial.
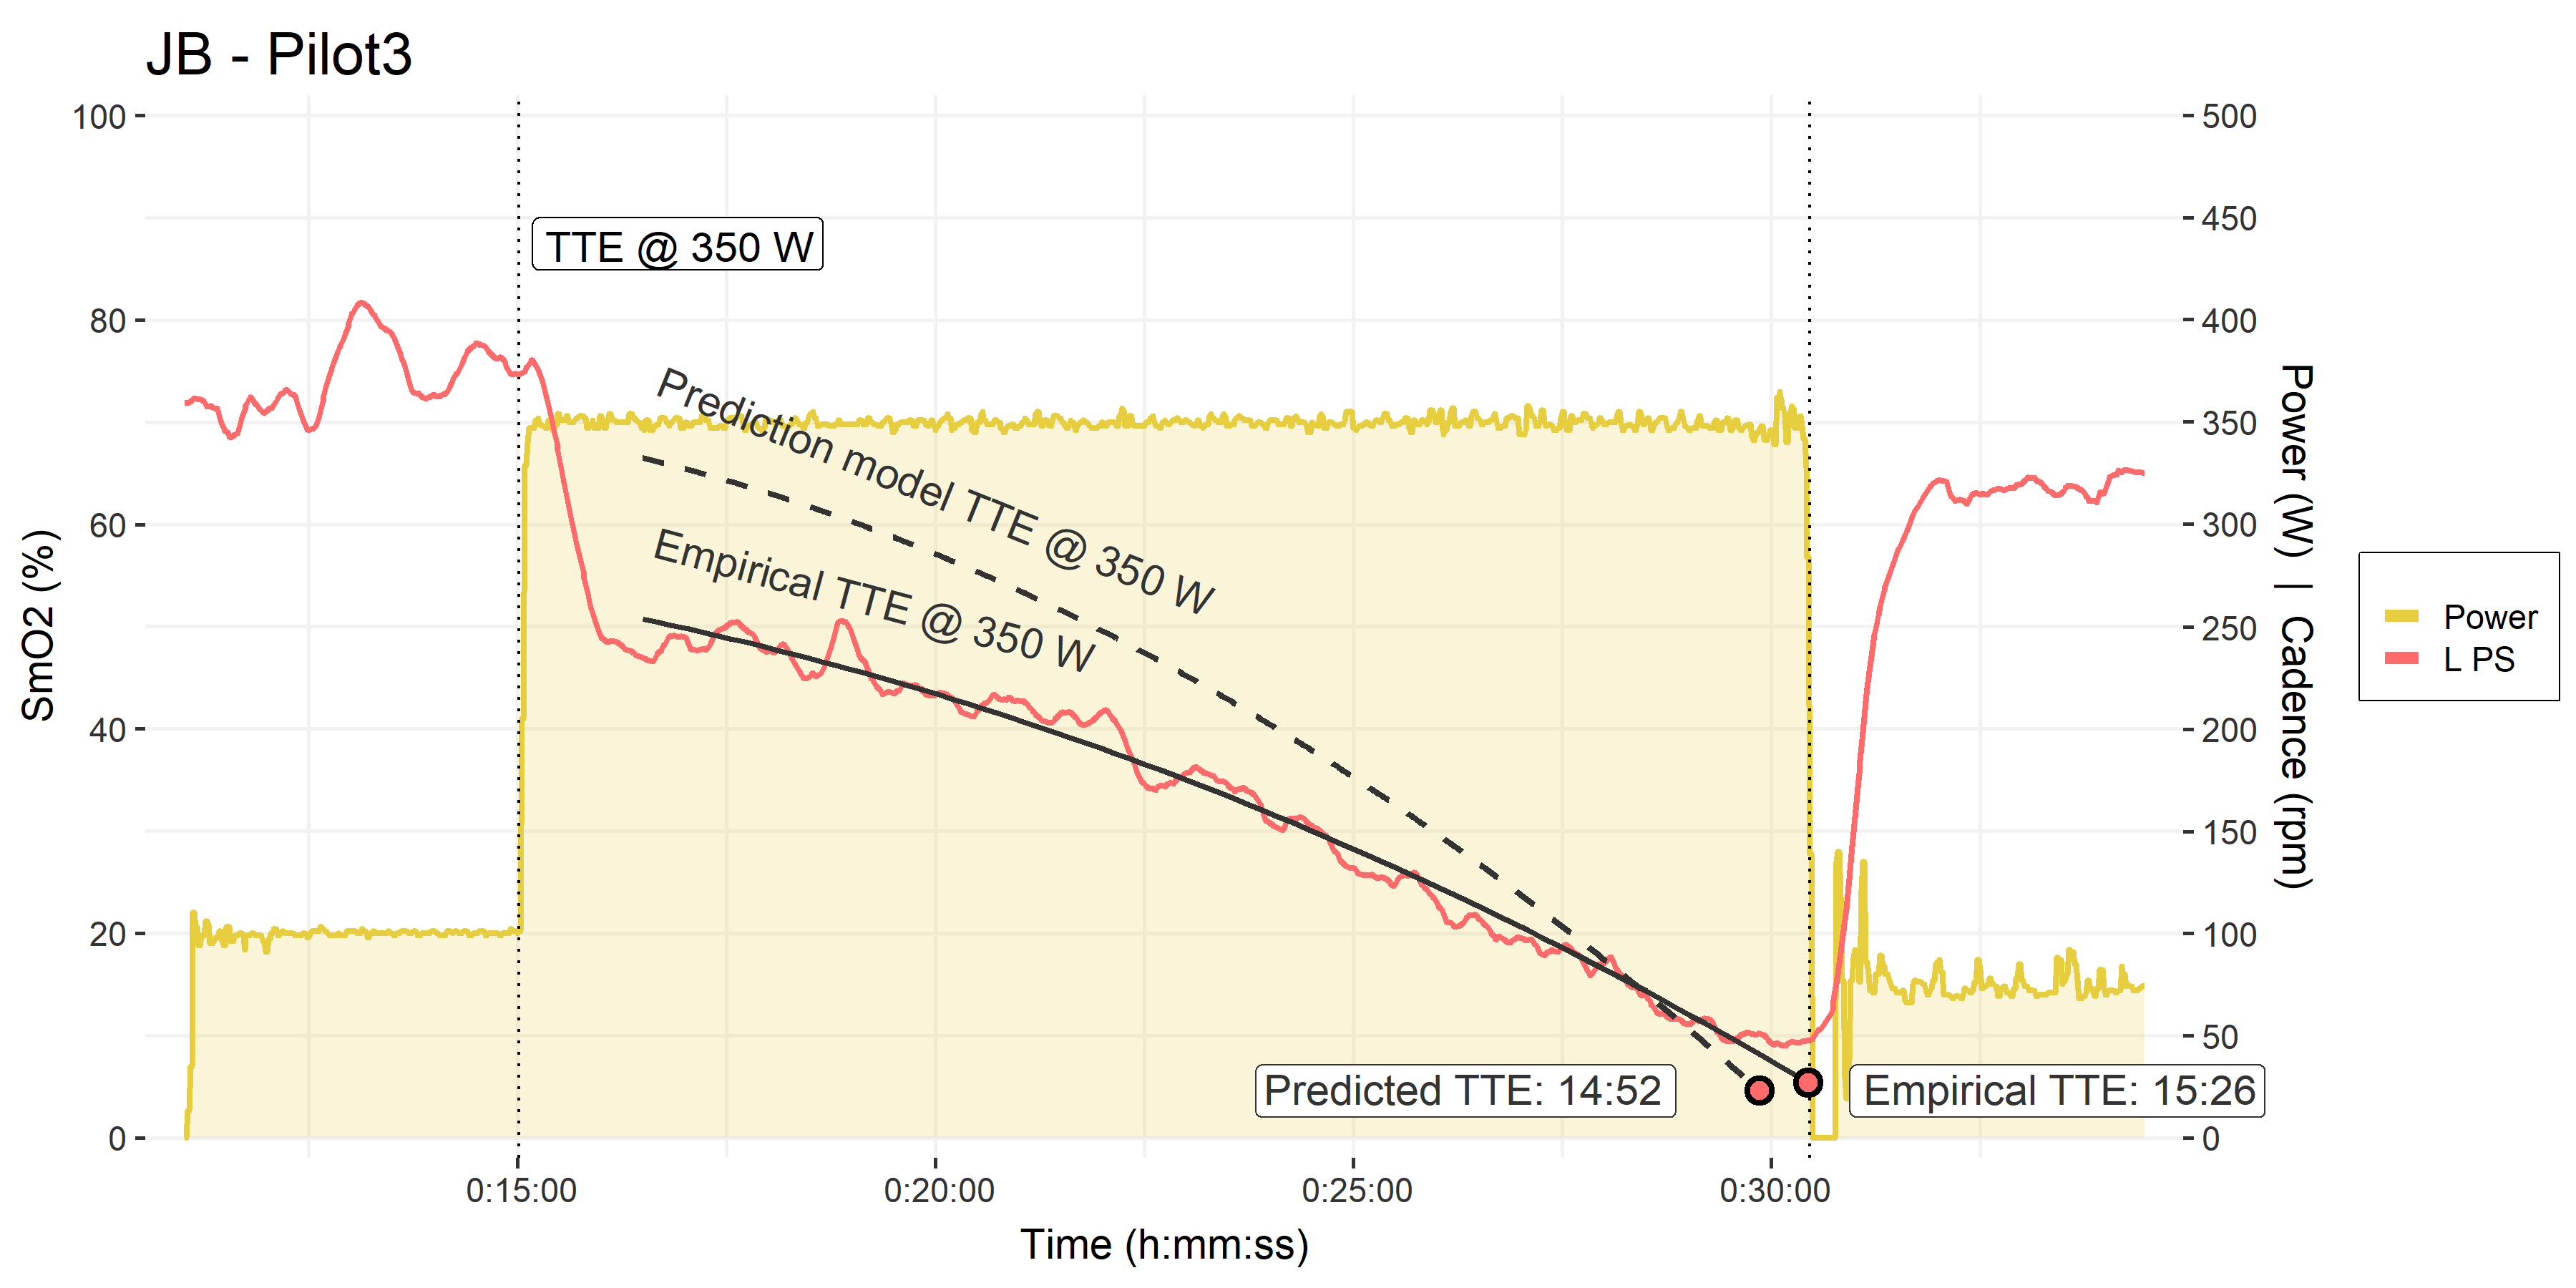
• Pilot trial #3, time to exhaustion at 350 W, as above.
• Empirical polynomial model fitted to the PS SmO2 data, and an empirical TTE of 15:26.
• The prediction model from his previous 10-minute interval is shown for reference, with a predicted TTE of 14:52.
First, note the improved deoxygenation onset kinetics at the start of the interval. He dropped from ~75% to only ~50%, and once again we see a monotonic deoxygenation through the TTE trial duration. Again, I attribute this to a better warm-up and starting with more oxygen in the tank, so to speak!
He reached beyond the 15-minute mark and just about beat his predicted TTE! Very impressive effort on his part. The empirical PS deoxygenation profile during this trial was quite consistent with the prediction model from his first 10-minute effort.
This is a promising anecdote for the utility of using paraspinals SmO2 slope to predict of time to exhaustion in a constant workload trial. But we will of course need to investigate this effect further in additional subjects, and free from the bias inherent to this pilot experiment. The ethics amendment has been submitted, and we should be able to start experimenting on this hypothesis within the month!
Is Paraspinals Oxygenation Sensitive to Cadence?
The first minor thing I wanted to explore is why we see a plateau appear in the PS SmO2 near the end of the two TTE trials? My hypothesis is that this is related to the subject approaching his work capacity limit, where he no longer has the work capacity to maintain the target power output of 350 W. And as a result, his cadence begins to drop, and because of how resistance is generated by the ergometer, his work output actually declines slightly. Let’s look at cadence during these trials to visualize how this might be playing out.
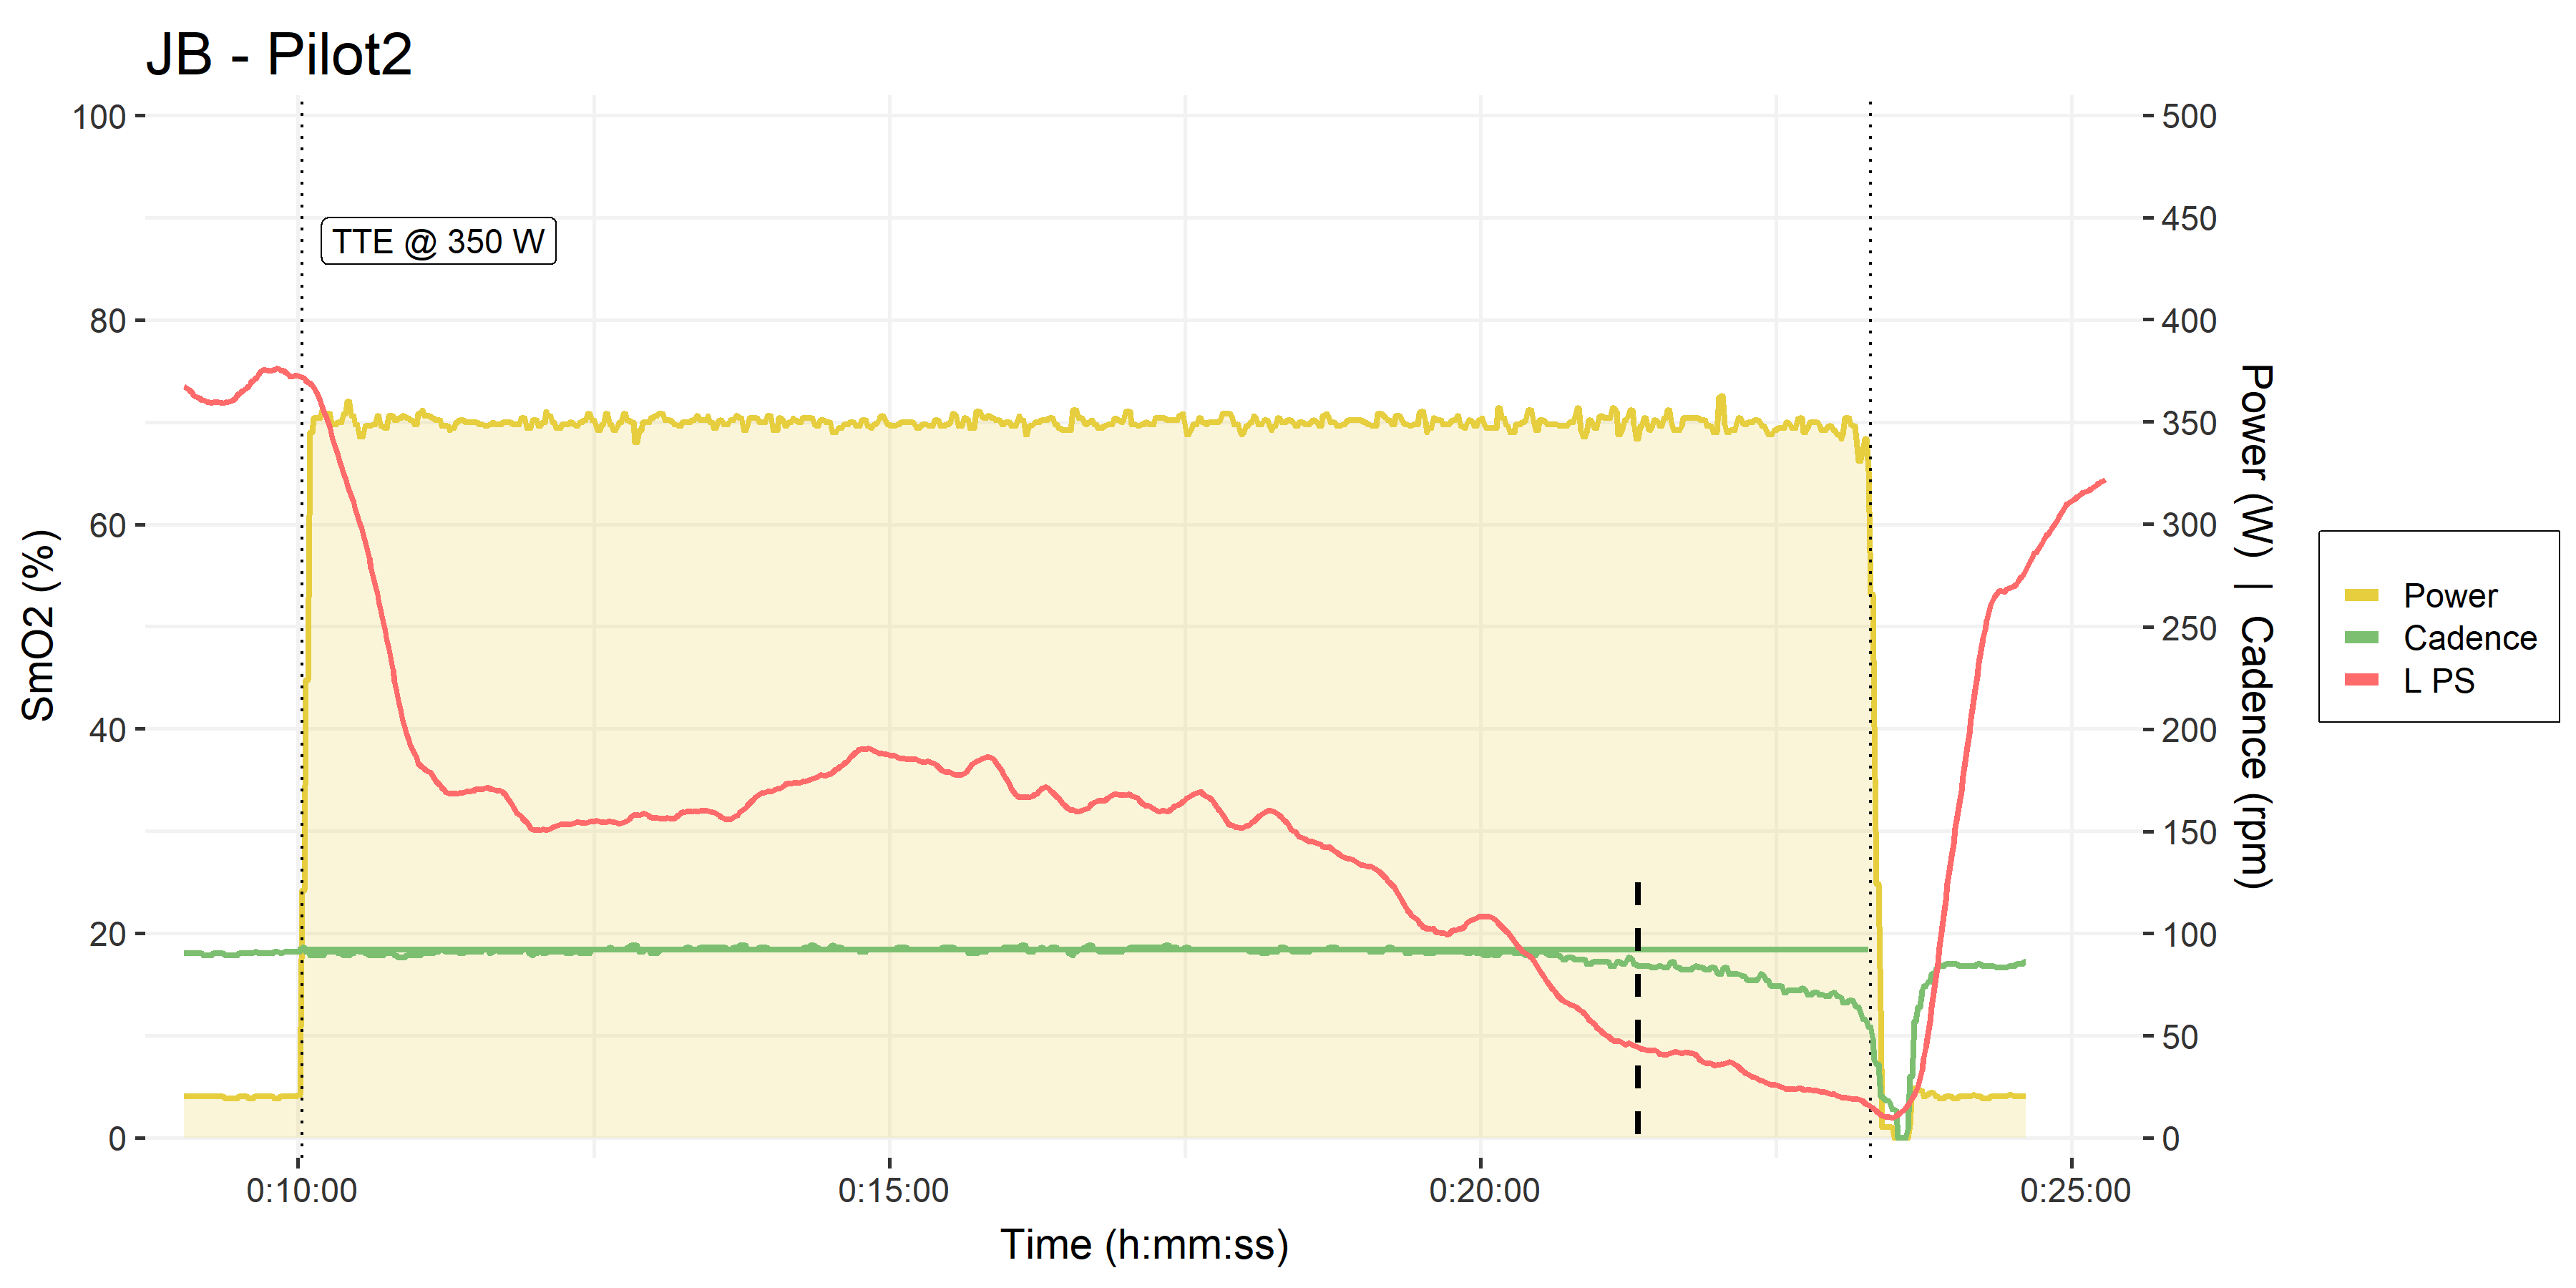

• Pilot trials #2 & #3, time to exhaustion at 350 W.
• Cadence in green, on the right y-axis.
• Black dashed line shows where L PS began to plateau, as cadence began to decline
With trainers in Erg mode, the trainer will electronically control resistance to match whatever cadence you are at, to maintain the target power output. If we suddenly increase our cadence, the trainer will have some lag where the power output will be too high, before it can lower resistance to match the new higher cadence to the target power output. And vice-versa: if we drop our cadence, the resistance will drop away until the trainer can bring it back up to target.
Often we see at the end of a maximal ramp test, or a constant workload trial such as this, that cadence will gradually decrease as pictured above. In this case, the trainer can have difficulty maintaining power output if cadence is declining at the same rate at which the trainer is trying to increase resistance. Although the reported power output may not change (as above), the real work done by the athlete can plateau in a ramp test, when it should be increasing; or in this case, the work may have been slightly below the target 350 W.
This may have contributed in part to the appearance of a plateau in the deoxygenation rate of SmO2, during both TTE trials. Trial #2 where cadence was gradually dropping for longer, shows a longer period where the PS deoxygenation rate is slowed rather than plateau’d. And Trial #3 where cadence only dropped near the very end, shows a correspondingly brief PS plateau, albeit at a slightly higher absolute saturation value.
If this is the case, then not only might PS be predictive of task intolerance at a constant workload, but it may be sensitive to cadence or body position changes at the same workload. Imagine riding at the same power in a TT position on the flat, compared to upright on a climb. Would your TTE change between those conditions? We can probably feel the different sensations in biomechanics, body position, and muscle tension. It might make sense that measuring oxygenation of the major pelvic & torso stabilizers would be sensitive to those differences.
The way I would modify the TTE test protocol would be to impose a tighter cadence cut-off, instead of stopping the subject when cadence falls to 60 rpm, I would impose that the subject stops when cadence falls by -10 rpm from their naturally selected cadence during the test.
What is the Relevance of Reaching ‘Zero’ Oxygenation?
Moxy scales the optical NIRS signal it receives to an a priori 0-100% scale (Feldmann et al, 2019). This allows the output measurement to have a greater apparent dynamic range than other NIRS devices with similar technologies (McManus et al, 2018), and ostensibly to be more sensitive to muscle tissue rather than superficial skin & fat layers. Zero oxygen saturation measured by Moxy probably doesn’t imply literally zero O2 available in the tissue being measured. But skeletal muscle O2 extraction is thought to be able to reach ~95% (Skattebo, 2020).
Generally, the trend and especially the direction of change of SmO2 are more relevant than the absolute values, especially comparing between subjects. A delta of ± 5% or a range of 10% has been proposed by the manufacturer as a meaningful magnitude of change. However, if repeated measures reach consistent values (which is what our current experiment with 5-1 assessments is evaluating), then we might be able to draw tentative conclusions based on a subject repeatedly reaching an individualized minimum value at task intolerance.
In this light, when the PS saturation repeatedly reaches near zero at task intolerance in some subjects… well, that’s a compelling anecdotal finding that I think deserves some blog-post speculation!
Across both male and female subjects, we have seen that in 25 of 36 trials at least one of the left or right paraspinals reaches < 10% absolute SmO2 at task intolerance, which is within the equivalency interval from zero. And in 29 of 36 trials at least one of the PS reaches a lower absolute minimum saturation value than both of the VLs at task intolerance, suggesting attainment of an individualized minimum.
The fact that this value appears to reach approximately zero at task intolerance is actually unusual: what other functional performance or physiological measurements reach zero at peak exercise capacity or task intolerance? HR, VO2, ventilation, and blood lactate all go up with intensity to an arbitrary/empirical maxima, and ‘zero’ is non-physiological (ie. we’d be dead!).
W’ (work capacity above critical power) and anaerobic speed reserve (ASR, a different work capacity above maximal aerobic velocity in running) are two values that deplete to zero at task intolerance above Critical Power. But these are empirical constructs derived from the performances themselves; W’ and ASR are calculated from maximal performances to solve for zero occurring at task intolerance, by definition. Whereas NIRS ostensibly is an a priori 0-100% physiological scale with no baseline or calibration necessary (or at least, the baseline calibration is done automatically before the data are reported).
Limitations of Predicting Performance from VL Muscle Oxygenation
If we compare PS to VL for my colleague’s TTE trials, we can see the typical issue encountered when trying to predict performance from muscle oxygenation:

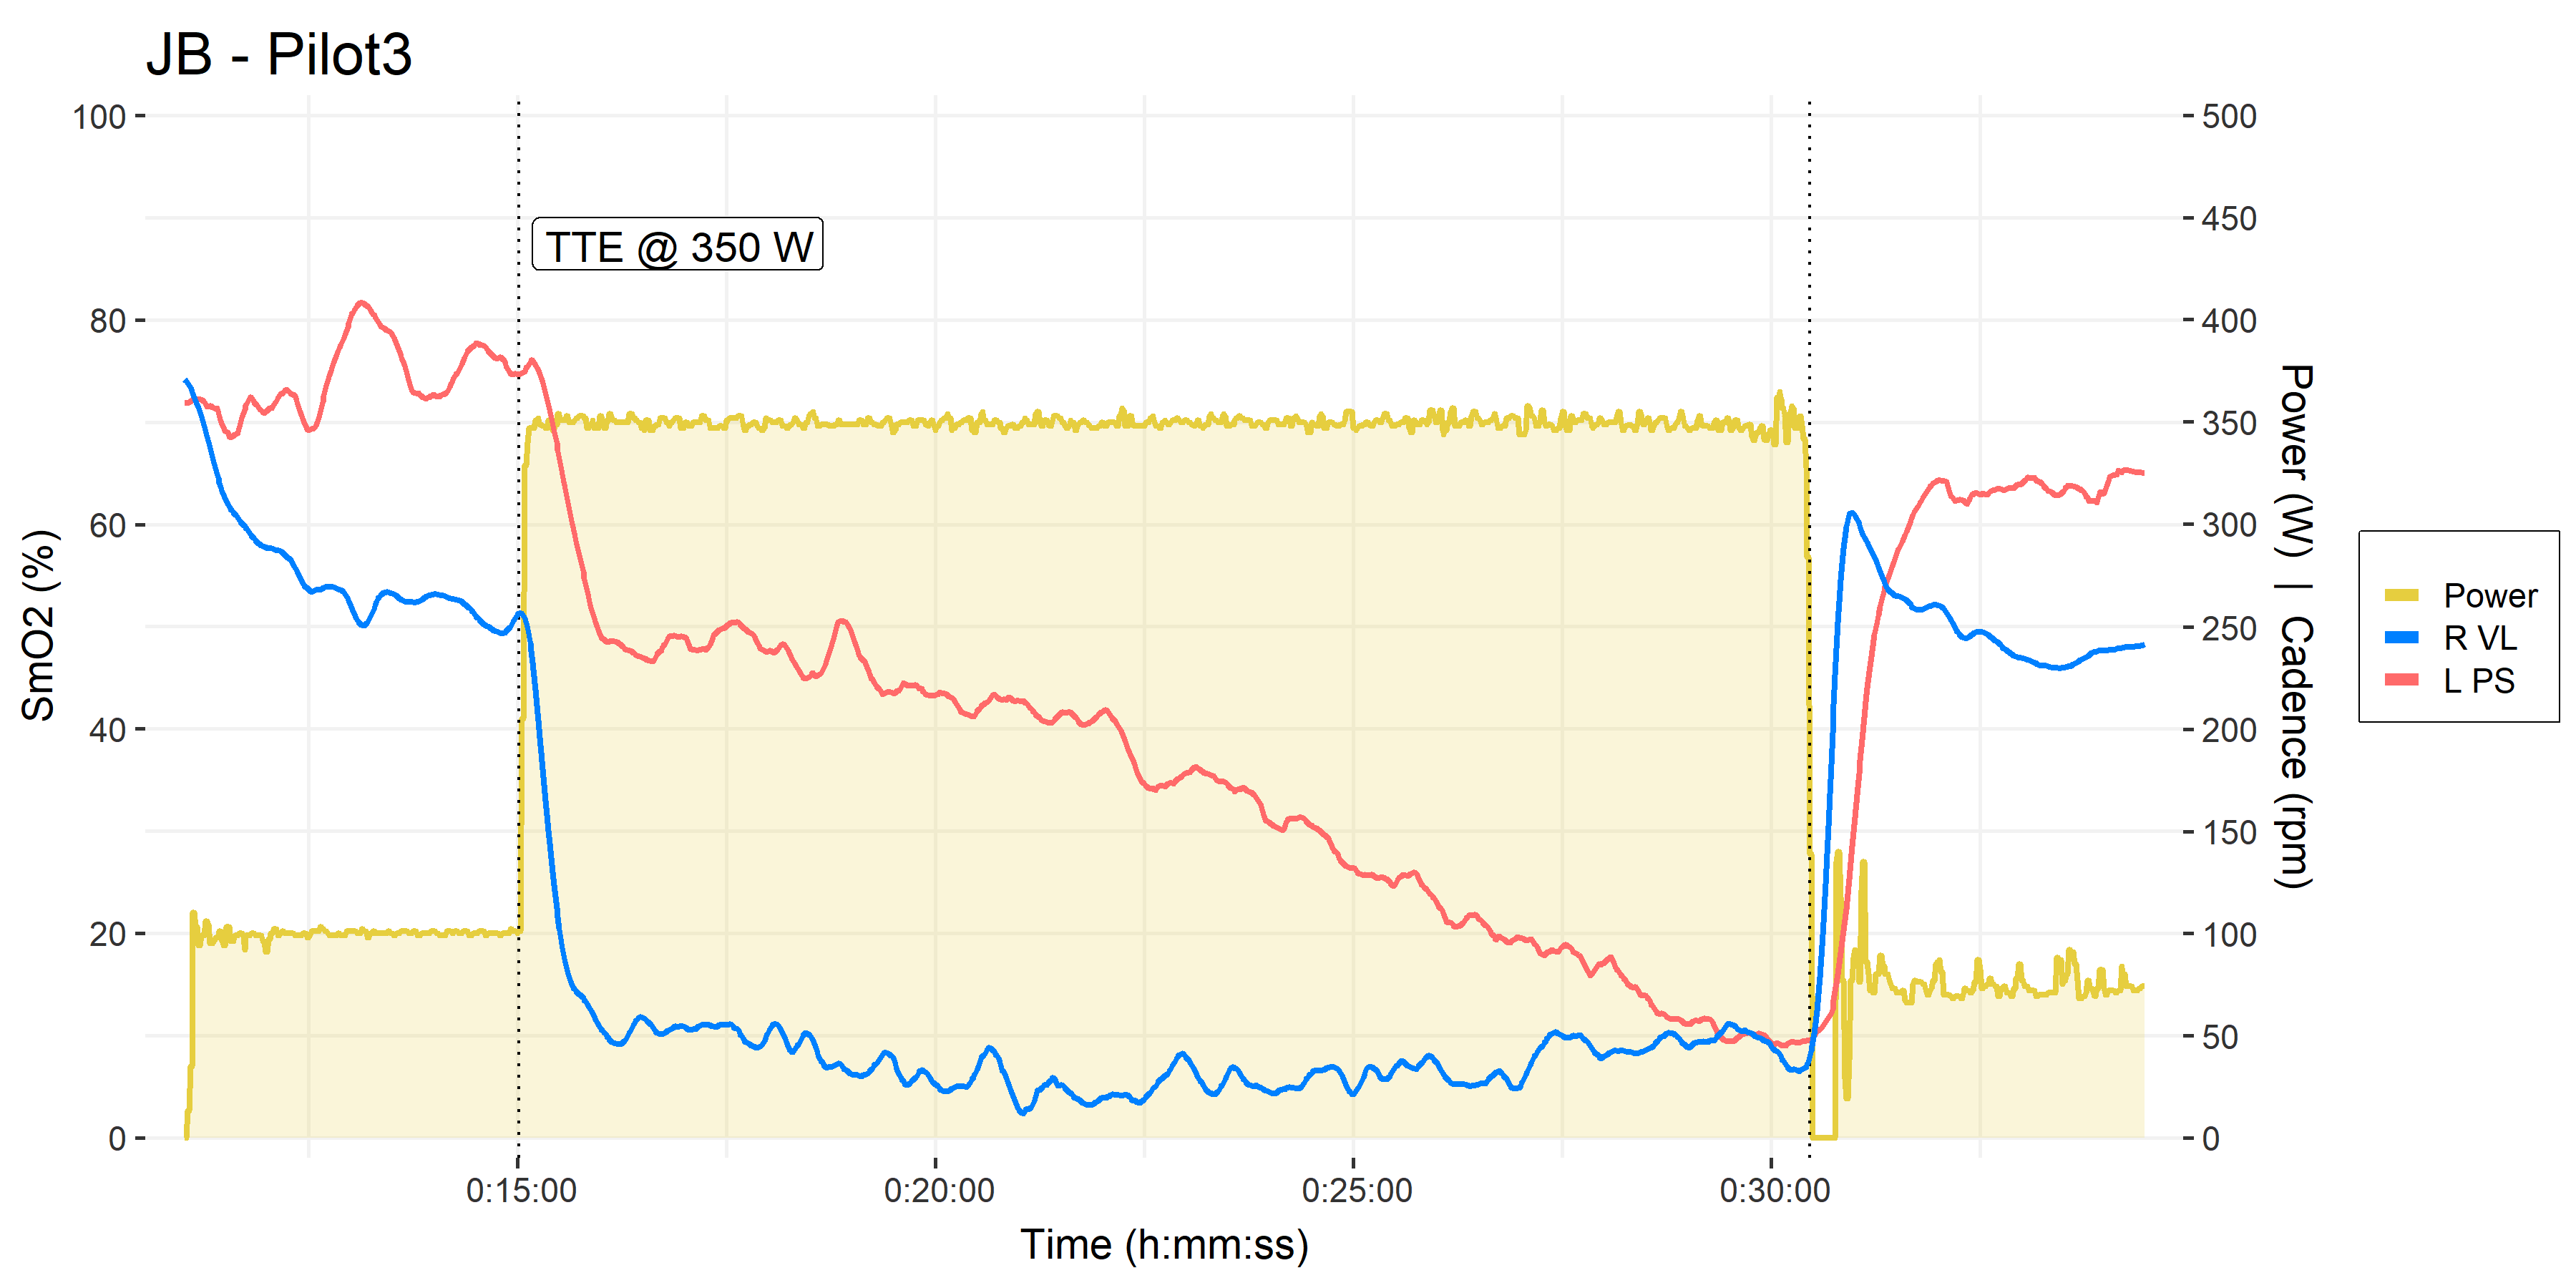
• Pilot trials #2 & #3, time to exhaustion at 350 W.
• VL in blue, PS in orangered
In my experience, this is a representative VL deoxygenation profile during severe intensity cycling in a lean, trained male athlete: VL immediately deoxygenates to some minimum, then basically stays there. As far as I can see, the VL offers no information on which TTE or performance could be predicted. There is no way to say how long the athlete will be able to maintain their minimum VL saturation.
We do sometimes see VL follow a deoxygenation profile more similar to the PS pictured here, ie. a linear or curvilinear decline. Especially more often in female athletes, which may be due to tissue composition differences. But even in those cases, we cannot be sure at what minimum SmO2 value the athlete will reach task intolerance, if not zero. This same concern exists for the PS, but as I mentioned, the PS appears to more consistently reach absolute zero SmO2, compared to the VL, across both male and female subjects.
[pre-publish edit:] On Dr. Andri Feldmann’s prompting, I ran a preliminary analysis of our 5-1 assessment trials (36x trials by 19 female and male subjects), using a simple linear slope model. To my surprise, I actually found that for both VL and PS independently, 27 of 36 trials have at least one signal (either left or right) that provides a reasonable TTE estimate. So it’s more of a fair split than I expected for the VL.
As I responded to Andri, maybe this shows that my initial visual interpretation that VL would not be useful to predict TTE was misleading, and taking a systematic approach as I’m trying to do here will be more fruitful. Hopefully the flat VL deoxygenation profile demonstrated by my colleague above will be the exception rather than the norm.
Here is an example from the subject I showed at the top of this post.
Two trials from the same subject
Trial #1 shows an example of where VL fails to predict a reasonable TTE, and the estimate gets cut off at 1:00:00. This occurred for both left and right VL channels in 9 of 36 trials. However, something similar also occurred for both PS channels, also in 9 trials (not necessarily the same trials). So more digging will be required to account for these failed models. And we will hopefully test if either location provides a consistent and reliable estimate of TTE.
Trial #2 shows some very consistent TTE predictions across all four VL and PS channels, which is promising.
I certainly find these observations compelling. I will continue to investigate paraspinals oxygenation in particular, and to improve my modelling abilities to take a more systematic approach to muscle oxygenation data analysis and interpretation.
I hope other Moxy users can test out these ideas with other athletes, to challenge the reproducibility of these preliminary findings. Please report back when you do!

Hi Jem,
Interesting work you’re doing with Moxy! I recently tried some intervals with one of my Moxy sensors on my lower back and wouldn’t you know… the SMO2 line behaves an awful lot like W’ Balance and dFRC. I need to do the workout a few times to see if the behavior is consistent. It would make sense that you might be able to estimate a TTE for a particular duration from SMO2 data, but it looks a bit dubious at this point?
Do you use Moxy during day-to-day training? I use my set often, but I still need to find an easy and convenient way to put a sensor on my shoulder or lower back reliably without using (wasting) a ton of tape.
LikeLike
Hi Dane, very cool to hear you’re trying the paraspinals location! Please keep me updated how you find the repeatability of the signals.
It would be a lovely, elegant model if SmO2 were to be predictive of W’ or TTE, but in practice it doesn’t seem to be that simple at the locomotor muscles 🙂
I’m not really training these days, so my Moxys are purely used in the lab. But yeah, I don’t have a great method for consistent self-placement at the paraspinals. Try to find a few rolls of cover-roll tape or something similar, but I don’t know of a better sustainable solution. If you find something, let me know.
LikeLike
Hi Jem,
very great blog with awesome articles!
I would be very interested to do similar analysis concerning Vo2 consumption during workouts as you. Besides the Vo2Master did you test any other devices (could be non-portabel but preferably cheaper :))? Currently, I am doing research if i can find a suitable device in the range of 1k-2.5k$ and wonder if you have any further knowledge concerning this.
I found this device: https://www.zone-x.at/english/. It is way cheaper – it measures O2, but not CO2. Downside would be that one can not measure fat / carbs burned, i guess. And it might not be as precise. But it might do the job in terms of 90+-Vo2 analysis?
Thanks in advance!
LikeLike
Hi Andreas, good question. I haven’t looked at any other system. Thanks for telling me about zon-x, I’ll look into that.
Prices for metabolic analysers will certainly continue to come down, however, the more I understand the methodological and engineering and calibration challenges of recording gas exchange accurately, the more I understand why laboratory-grade devices continue to be $10’s of thousands.
Think about the modern cost of a power meter compared to 20 or even 10 years ago. But also consider that a power meter is measuring a ‘single’ data point (I know it’s more complicated than that), and also consider the variability we see between power meters. What, as much as 10 – 20 W? Which maybe doesn’t matter too much. But the equivalent inaccuracy in any one ventilation or gas exchange parameter could make the values physiologically meaningless.
I really hope to see continued progress and competition in these little niche markets for wearable VO2 analysers and NIRS.
More importantly, I really hope we’ll see some progress in the interpretation and application of the information these devices can give us, so that individual athletes can benefit, beyond having another pretty chart to look at.
LikeLike