The 5-1 assessment we run is a submaximal intermittent step test that uses NIRS and VO2 to identify physiological thresholds and training zones. I’ve mentioned it before. We use the general terms ‘Aerobic Threshold’ (AeT) and ‘Anaerobic Thresholds’ (AnT) for the first and second breakpoints respectively, and a polarized 3-zone model between these thresholds.
The benefit of this assessment is that it can evaluate underlying physiological limiters to performance and guide specific training interventions to address those limiters. This test design is inspired by Juerg Feldmann’s 5-1-5 assessment.
I performed two trials of this 5-1 assessment 48 hours apart with the same set-up as in the previous article. One trial with the VO2 Master Pro, the other with the TrueOne 2400. This protocol consists of 5min work steps with 1min passive recovery intervals between each work step. The workload begins at 100 W and increases by 40 W each subsequent step until the athlete is above Anaerobic Threshold, as determined by the NIRS-derived deoxygenation-breakpoint, and confirmed by ventilation and blood lactate. We then stepped-down to the last work step before Anaerobic Threshold and repeated two 5min work steps to observe whether physiological equilibrium could be re-stabilized.
Intermittent ‘5-1’ Step Tests

- I just noticed the cadence and power charts were slightly mis-aligned in this image. Not a big deal.
- Slightly higher cadence during the TrueOne trial, especially during the severe intensity 340 W step and subsequent 300 W step-downs could have caused slightly higher VO2. We do see higher VO2 throughout the TrueOne trial for the same work steps.
- Power will be displayed for all charts below to demarcate work & rest steps.

- Once again VO2 is more variable with the VO2 Master Pro during the lowest intensity steps, due to the measurement limitation under VE of 40 L/min with the Large user piece.
- This chart includes VO2, Blood Lactate (BLa), and rating of perceived exertion (RPE from 1-10) measured in the final minute of each work step.
- The TrueOne trial had higher VO2 on average, and correspondingly lower BLa and slightly lower RPE than the VMPro trial. Also note the continued increase in BLa during the final two 300 W step-downs, where BLa appeared to stabilize during the VMPro trial and continued to increase during the TrueOne trial, albeit from a lower magnitude.
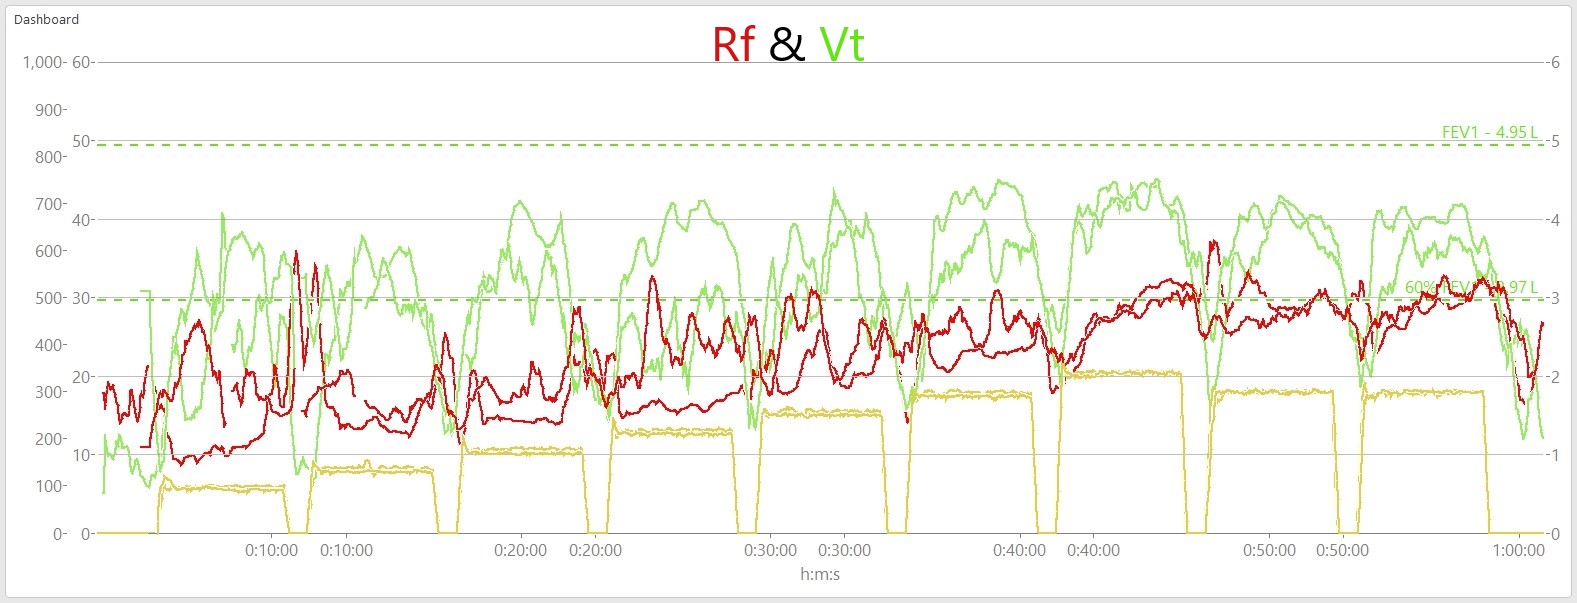
- Respiratory Frequency (Rf) and Tidal Volume (Vt): how quickly I was breathing, and the depth of each breath
- Peak Rf: VMPro = 33, TrueOne = 37 brpm
- Peak Vt: VMPro = 4.5, TrueOne = 4.5 L
- Rf & Vt were highly inconsistent during the early steps. I was probably distracted and talking with my colleague during the very easy first few steps.
- Note during the severe intensity 340 W work step and subsequent 300 W step-downs both Rf & Vt show much closer similarity between trials.
- FEV1 and 60% FEV1 included again for reference for my pulmonary capacity. (see explanation in the previous article)

- Minute Ventilation (VE): the volume of gas exchange per minute
- Once again I had to do some manipulation of the data after recording to directly compare both devices.
- Despite inconsistent Rf & Vt during the early steps (as above), VE shows better consistency between trials throughout the assessment. Apart from the first 1-2 steps under the 40 L/min limitation of the VMPro, as previously mentioned.

- Fraction of Expired Oxygen (FEO2) is the leftover O2 expired that isn’t taken up at the lungs for gas exchange.
- VE/VO2 is the ratio of ventilation to oxygen consumption. This ratio is used to determine the first ventilatory breakpoint (VT1 or Gas Exchange Threshold: GET).
- Vertical purple lines indicate the work step at which this ventilatory breakpoint in VE/VO2 occured. Note the magnitude of the lines are different due to the difference in how each device reports VE. This doesn’t matter for the sake of determining the VE/VO2 breakpoint, since the ratio is based on a minimum, regardless of magnitude.
- The dotted yellow line at 16% FEO2 shows recommended target for ‘efficient aerobic gas exchange’ (see previous article for explanation). Compared to the previously looked at ramp tests my FEO2 during this step test was lower for longer, up to a higher relative intensity. This is probably related to the constant power work steps, where my body was able to reach a stable and efficient equilibrium, at least until the very highest work steps (see below).
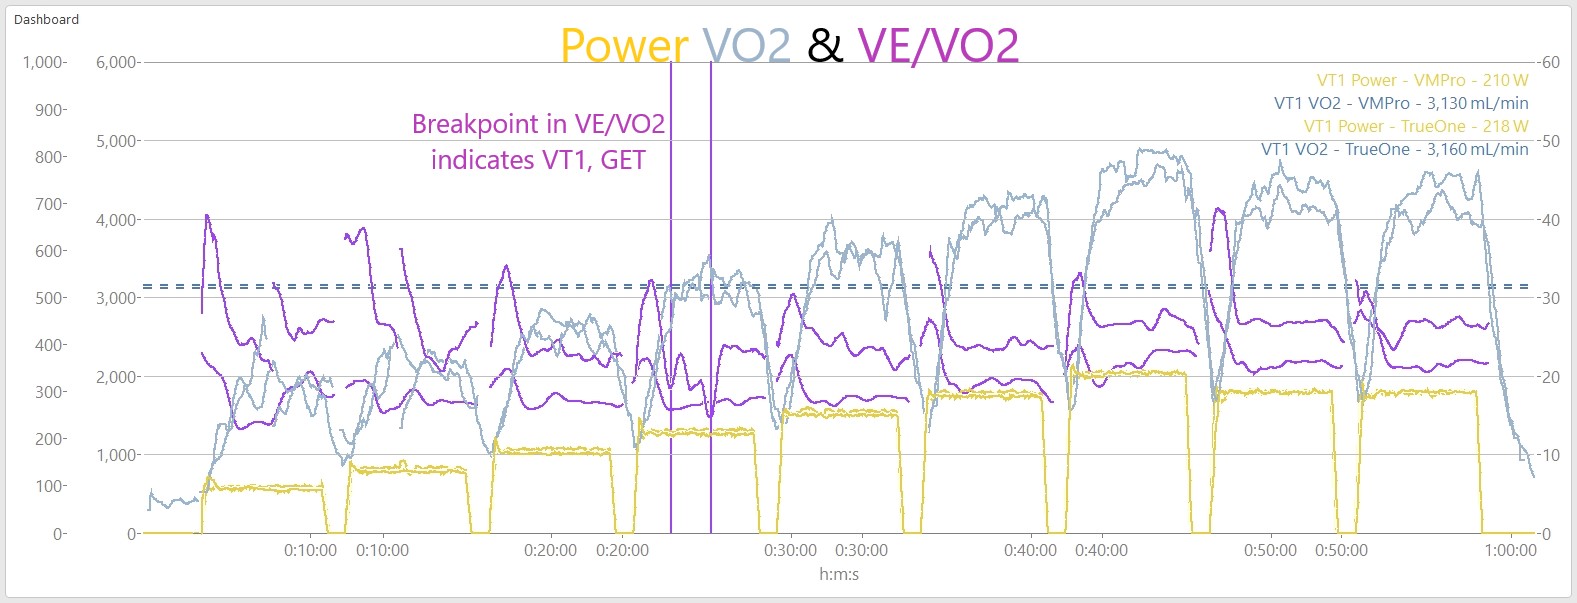
- This is a similar chart as above, omitting FEO2 and including Power and VO2 at the VT1/GET breakpoint in the top right corner.
- VMPro Power at VT1: 210 W (48% PPO from ramp test)
- TrueOne Power at VT1: 218 W (51% PPO)
- VMPro VO2 at VT1: 3130 mL/min (60% VO2peak from ramp test)
- TrueOne VO2 at VT1: 3160 mL/min (61% VO2peak)
- Note: VO2 is not left-shifted to account for the mean response time between power output at the legs, and systemic ventilatory response at the lungs. MRT-shifted VO2 at this point will be slightly higher than presented here.
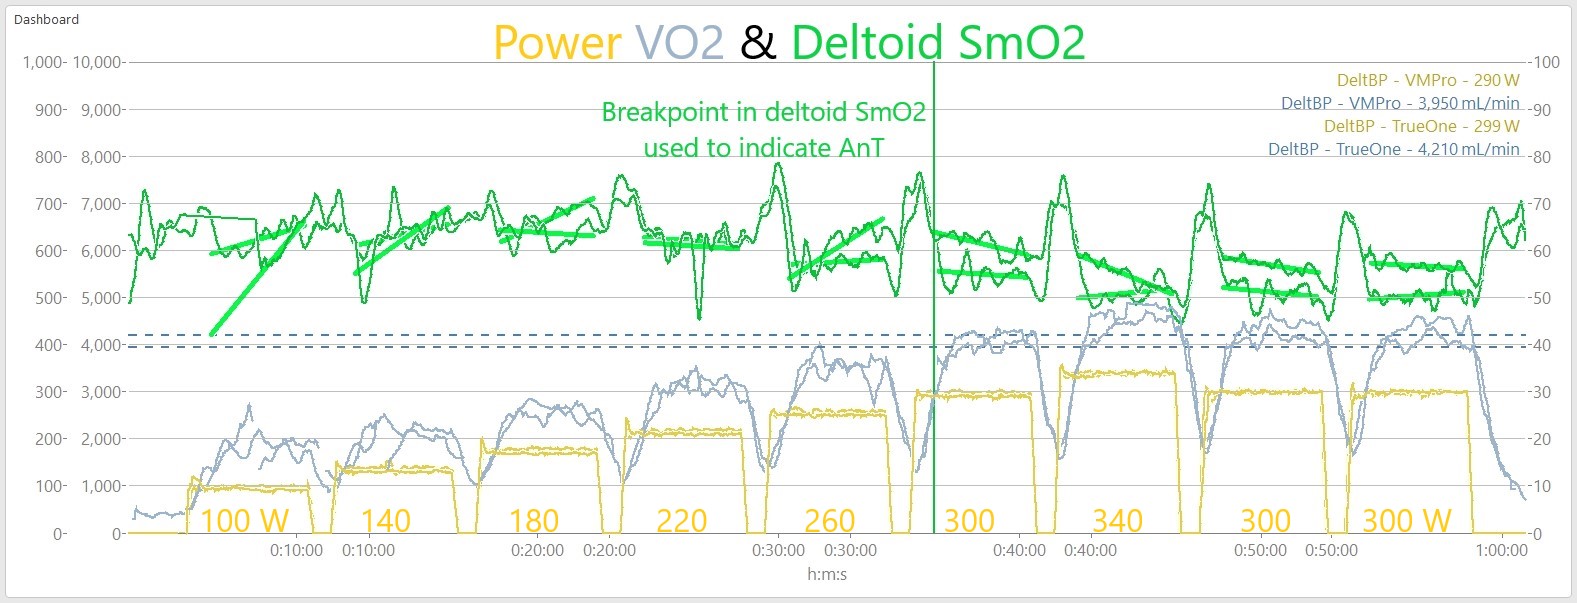
- Muscle Oxygen Saturation (SmO2) measured at the deltoid (shoulder) muscle with the Moxy Muscle Oxygen monitor.
- VMPro Power at deltoid-breakpoint: 290 W (67% PPO from ramp test)
- TrueOne Power at deltoid-bp: 299 W (70% PPO)
- VMPro VO2 at deltoid-bp: 3950 mL/min (75% VO2peak from ramp test)
- TrueOne VO2 at deltoid-bp: 4210 mL/min (81% VO2peak)
- Note: VO2 is not left-shifted to account for mean response time. MRT-shifted VO2 at this point will be slightly higher.
- This chart shows SmO2 (green) from the Moxy sensor positioned on the deltoid (non-priority/ non-locomotive muscle) on top of Power and VO2. In our ongoing research we have found a reliable breakpoint in non-priority muscle deoxygenation around the Respiratory Compensation Point (RCP) or second Ventilatory Threshold (VT2). The appearance of a deoxygenation breakpoint in NIRS-derived values (eg. SmO2) is thought to be related to Critical Power, Maximum Lactate Steady State, or FTP.
- Average slope of the deltoid SmO2 curve is highlighted during each work step. This helps to visually identify where the trend turns negative, indicating the athlete may have exceeded deltoid-breakpoint and Anaerobic Threshold.

- The deltoid-bp above was surprisingly messy. Usually the signal is more robust. We also measured SmO2 with Moxy on the right gluteus, near the ischial tuberosity insertion.
- This Glute deoxygenation signal gave us a clear confirmation of this breakpoint at the 300 W work step and attainment of Anaerobic Threshold. Basically the negative slope indicates that O2 delivery is no longer able to match O2 demand imposed by the workload. ie. the body is no longer able to reach a metabolic equilibrium, and fatigue will begin to accumulate more rapidly.
- Moxy measures change in the tHb & SmO2 signals, so the magnitude of the curves is much less important than the trend or behaviour in response to a changes in workload.
Conclusions
These trials offer a good opportunity to compare the devices over a longer duration, under changing fatigue conditions, changing metabolic fuel utilization (fats vs carbs), and supported by blood lactate measurements. Once again the VMPro appears very promising for validity in the lab in this n = 1 trial, but more data and rigorous statistical comparisons will be necessary to confirm.
Speaking of fuel utilization, currently a major limitation to the VO2 Master Pro is the inability to measure VCO2 along with VO2. This means the VMPro is unable to measure important metabolic information like FatMax or carbohydrate refueling. Nor can it properly assess the Respiratory Compensation Point (RCP) or second Ventilatory Threshold (RCP or VT2) which also rely on the ratio of VO2 and VCO2 gas exchange.
VO2 Master is currently working on fitting a capnometer (a CO2 sensor) into the hardware, which I’m eagerly looking forward to testing. I’m already working on a more accurate model for describing the VO2-Power relationship including accurate assumptions on metabolic fuel utilization.
With the past two articles we have looked at how the VMPro stacks up against a traditional metabolic cart in relatively well controlled lab conditions. The next step is to look at the VMPro in the lab compared to the field where conditions are less predictable

Now this is getting into the details! If it wasn’t for the price i think one of those would be very useful to control training and maximize time at vo2max.
LikeLiked by 1 person
Hi Jem,
What’s the longest training session you could realistically use the VO2 Master for, assuming comfort of the wearer? Have you noticed any sensor drift during usage outside riding around?
I have a Pnoe device and the flow sensor is unreliable (lots of data spikes and completely erroneous readings after 35+ minutes of testing), so I’m looking at VO2 Master.
Thanks!
LikeLike
Hi there,
Yeah unfortunately in my experience there is a bit of a limit on how long VO2 Master is reliable for. The usual issue I encounter is moisture infiltration from exhale building up and interrupting the O2 sensor. Causing FEO2 and VO2 readings to drift. Of course it depends on the environment and the nature of the efforts, rather than flat time. I’d say I’ve seen issues as early as ~30min, but I’ve also worn it for ~90min with no issues. It can be a subtle drift, which is almost worse. It’s the kind of thing that I don’t quite know if the data are still valid or not until after, or if the sensor stops reading entirely.
There is some best-practice advice that help minimize moisture infiltration, but I still find it a major reliability limitation for regular use in lab or field, unfortunately.
LikeLike
Thank you for your insight! It sounds like consumer VO2 measurement is just not ready yet, regardless of device. I had high hopes that I could have lab-quality measurements in my garage but the technology is not there. For 5,000$ USD, I’d hope for better data.
Maybe purchasing a second-hand lab-grade unit is the way to go? But those can be 10,000$ USD easily.
LikeLike