Sometimes more information gives us more precision
Me, if I tweeted or something…
Sometimes more information gives us more flexibility
A structured training program needs both
We recently published an article in Frontiers in Physiology comparing the NIRS-derived deoxygenation-breakpoint (deoxy-BP) to the respiratory compensation point (RCP, also known as the second ventilatory threshold, VT2) in a ramp cycling test.
I want to use this and another similar study to understand the important differences between threshold measurements, the natural variability involved in measuring a physiological state, and how understanding this variability can help us prescribe training targets for ourselves and our athletes, so that we can be more confident that the prescribed target will elicit the desired training stimulus.
Yogev et al, 2022. Comparing the Respiratory Compensation Point With Muscle Oxygen Saturation in Locomotor and Non-locomotor Muscles Using Wearable NIRS Spectroscopy During Whole-Body Exercise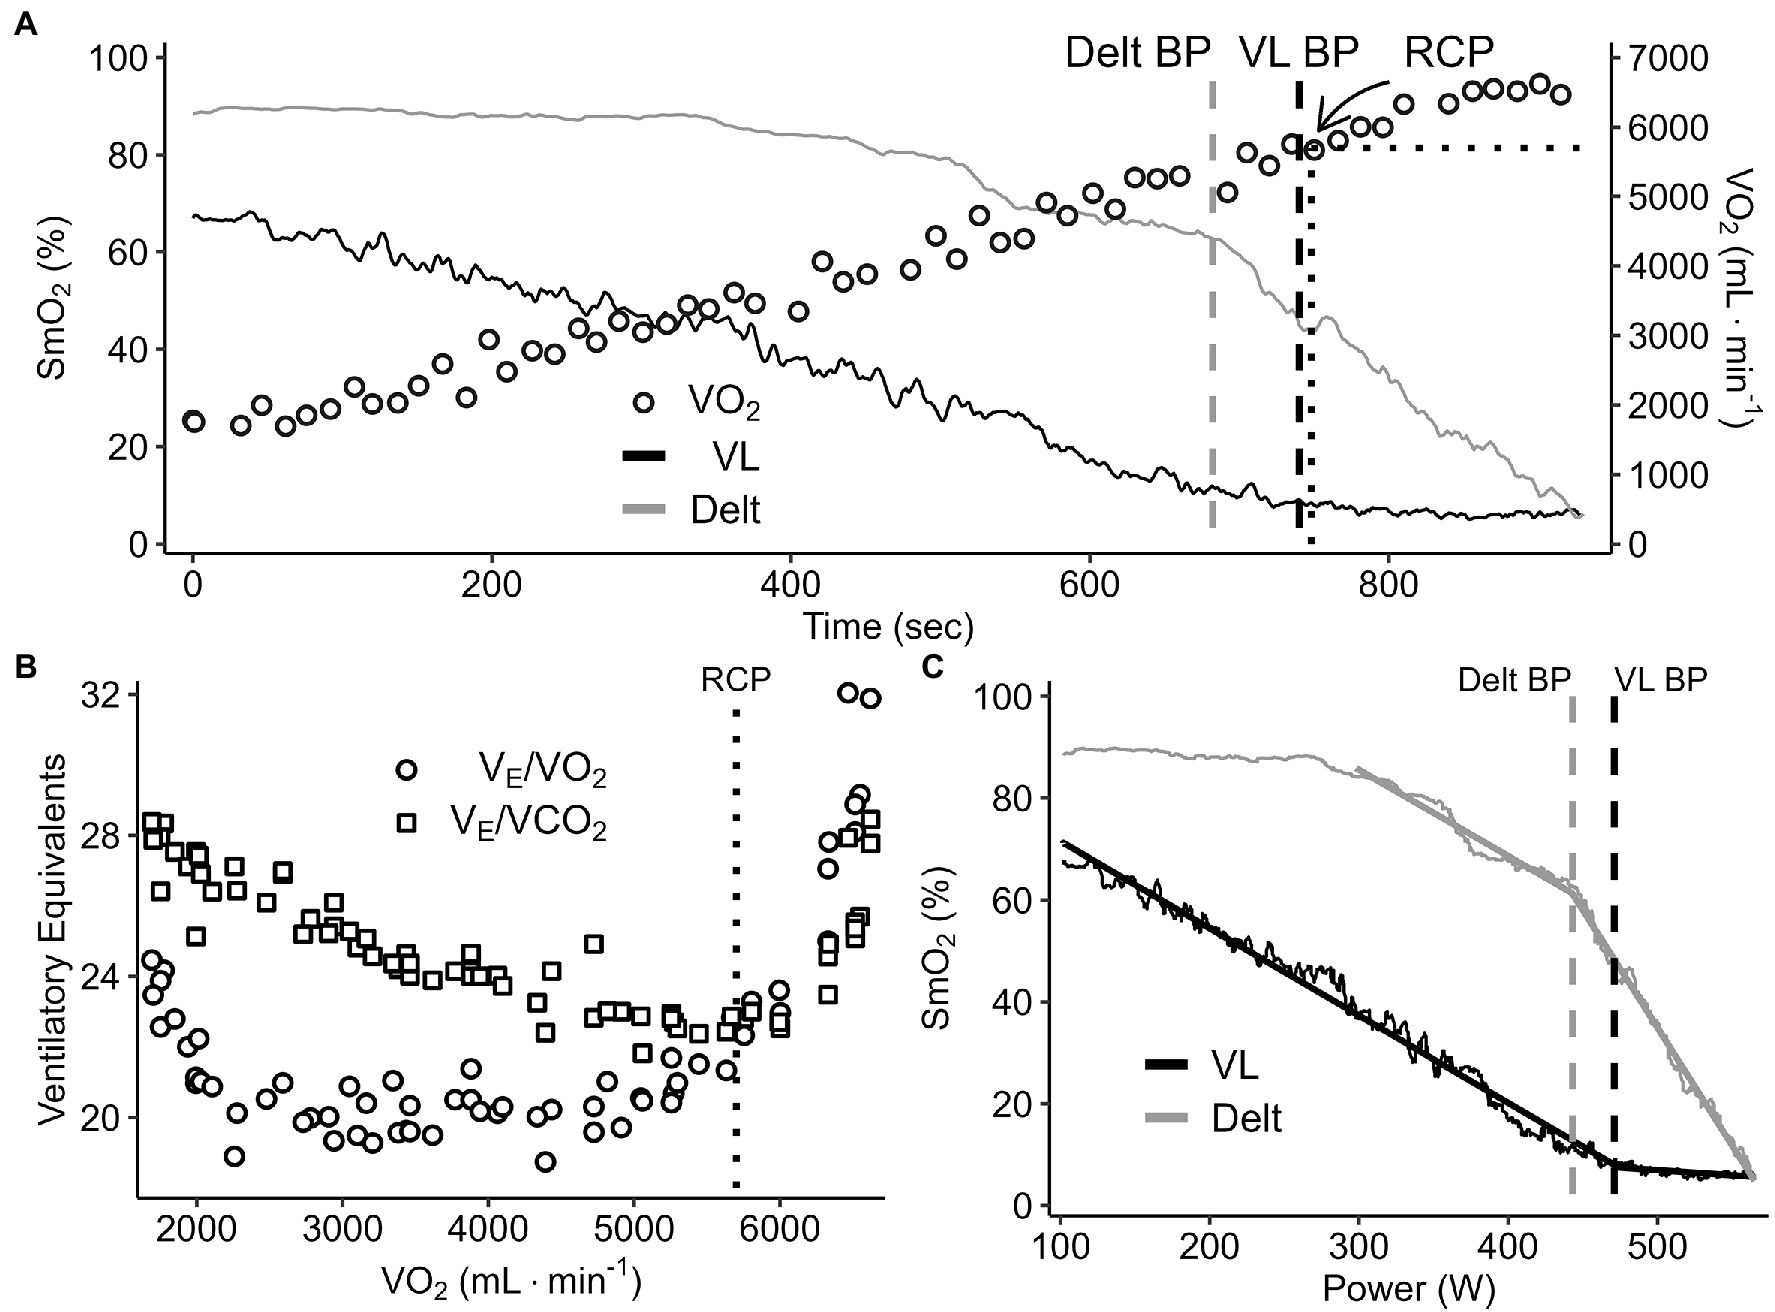
Figure 2. A representative data set of breakpoint detection and comparison between the change in SmO2 (VL and deltoid) and V̇O2 (panel A), ventilatory equivalents of O2 and CO2 (panel B), and SmO2 VL and deltoid profiles (panel C) during a continuous graded exercise test from rest to task intolerance.
Our article is freely available, and I encourage everyone to also read some of the other articles in the research topic on Near-Infrared Spectroscopy Technique and its Application in Exercise Settings.
Comparing RCP to Deoxy-BP
To summarise our article, we had 22 subjects (female n = 5, male n = 17) of mixed fitness levels (VO2peak range 48 – 77 ml/min/kg, Wpeak range 4.1 – 6.6 W/kg) perform a ramp cycling test with NIRS (Moxy monitor) measured at both the quadricep (VL) and deltoid muscles, as well as pulmonary gas exchange for VO2 and ventilation.
We determined deoxy-BP at both the VL and deltoid separately, and we also determined RCP from gas exchange via standard methods, as illustrated in Figure 2, above.
The deoxy-BP is thought to represent a change in the balance of local oxygen delivery and uptake within the peripheral muscle. While the RCP is a breakpoint in the ratio of expired gases and ventilation that represents a systemic shift in metabolic energy provision.
These breakpoints have been associated to a greater or lesser extent (as we will see!) to each other and with other well-established metabolic breakpoints, such as the second lactate threshold (LT2) critical power (CP), maximum lactate steady state (MLSS), functional threshold power (FTP), and many others.
Our primary findings were that in terms of VO2, power output (PO), or time of occurrence, there were no significant differences between RCP and deoxy-BP at either VL or deltoid for the group as a whole. However, importantly there were meaningful differences between breakpoints at an individual level, where the differences could be as much as 100 W either higher or lower!

Bland-Altman plot showing mean bias and limits of agreement (LOA) for power output associated with deoxy-BP measured at VL, and with RCP. The bias tells us that the RCP is 16.6 W lower on average than the VL deoxy-BP. LOA are equivalent to 95% confidence interval, discussed further below, suggesting that for 95% of expected individuals or trials, we would expect these two thresholds to be within -115 to +82 W of each other. Said another way, the difference between RCP and VL deoxy-BP at a population level is expected to be -16.6 ± 98 W.
Clearly then, for any single athlete we cannot say where any one breakpoint is just by knowing where another breakpoint is. But why should we even care how well deoxy-BP agrees with RCP, or any one threshold measurement agrees with any other? That is what I want to discuss here.
Constructs and Operationalisation
The first concept to understand is the difference between the construct of the maximal metabolic steady state (MMSS), which is the highest workload at which an elevated metabolic homeostasis can be maintained at a steady-state for a relatively long period of time. And how that construct is operationalised by measuring various physiological breakpoints or thresholds.
MMSS is a theoretical physiological state which can’t be measured directly. It has a simple enough sounding definition at first, but we need to further define our terms if we are to quantify it for measurement.
For example, we could determine ‘an elevated metabolic homeostasis’ by measuring blood lactate (BLa) and defining it as a rise of no greater than 1.0 mmol/L over the last 20 minutes of a 30 min constant workload interval. This also quantifies our definition of ‘a relatively long period of time’.
This is the operational definition of MLSS, which is probably the most direct physiological measure of MMSS. This protocol controls both workload and duration and measures BLa as the marker of the metabolic response. But the trade-off is that it requires multiple tests across multiple sessions to determine the precise workload that elicits MLSS, and is thus associated with MMSS.
An incremental ramp test is a single-session protocol where the effect of workload on metabolic response can be measured, without a significant effect of duration*. For this protocol we can operationalise our measures of metabolic state as systemic gas exchange (VO2 & ventilation) and peripheral (local) muscle oxygenation (SmO2). If we understand the mechanisms and expected response profiles of these measures as workload is increased, we can identify the breakpoints that represent crossing over of the MMSS, thus operationalising the MMSS as either RCP or deoxy-BP, respectively. But as we will see in the follow-up paper below, the trade-off to this more convenient test protocol is higher variability of the outcome measures.
*Of course, we can’t just ignore the real effects of duration on metabolic intensity, and this protocol requires further processing & corrections on the back end when translating incremental exercise back to constant workload exercise. ie. the mean response time (MRT) method we use, described further in the paper.
Taken further, the most convenient and thus common protocol to estimate MMSS is the 20 minute FTP test, which measures only power and applies a fixed a priori correction factor. It’s a good enough performance outcome measure, but it has potentially very wide error bars when compared to other physiological measures.
We should now be able to appreciate the important difference between the construct of a metabolic threshold, and the operational definition or measurement that represents that construct. Thus, we can only ever approximate the MMSS, and critically: all threshold measurements are specific to a given test protocol, outcome measure, and analysis method.
Variability and Confidence Intervals
If we can only ever approximate MMSS, then we have to appreciate there will inevitably be some sources of error or variability in our measurement, unique to our particular operationalisation. We can consider both biological and methodological sources of variability.
Considering biological variability, MMSS itself will have meaningful variation for a single athlete depending on their current physiological state. For example, time of day, fatigue state, environmental conditions, mental state will all interact to have an effect on MMSS. This is in addition to the variability of the particular physiological measurement (eg. BLa, VO2, or SmO2) related to the same physiological state. Of course, individual differences including fitness, training history, metabolic phenotype, tissue composition and heterogeneities will also influence the measurement.
Methodological variability includes measurement error of any devices (including our power meter or trainer resistance), protocol characteristics (eg. ramp rate, workload, duration), within- and between-rater (intra- and inter-rater) reliability (eg. the small differences in set-up, execution, and interpretation between any two test sessions: NIRS sensor placement is an important example here with outsized effects on muscle oxygenation results), and differences in analysis approach can all significantly affect outcome measures.
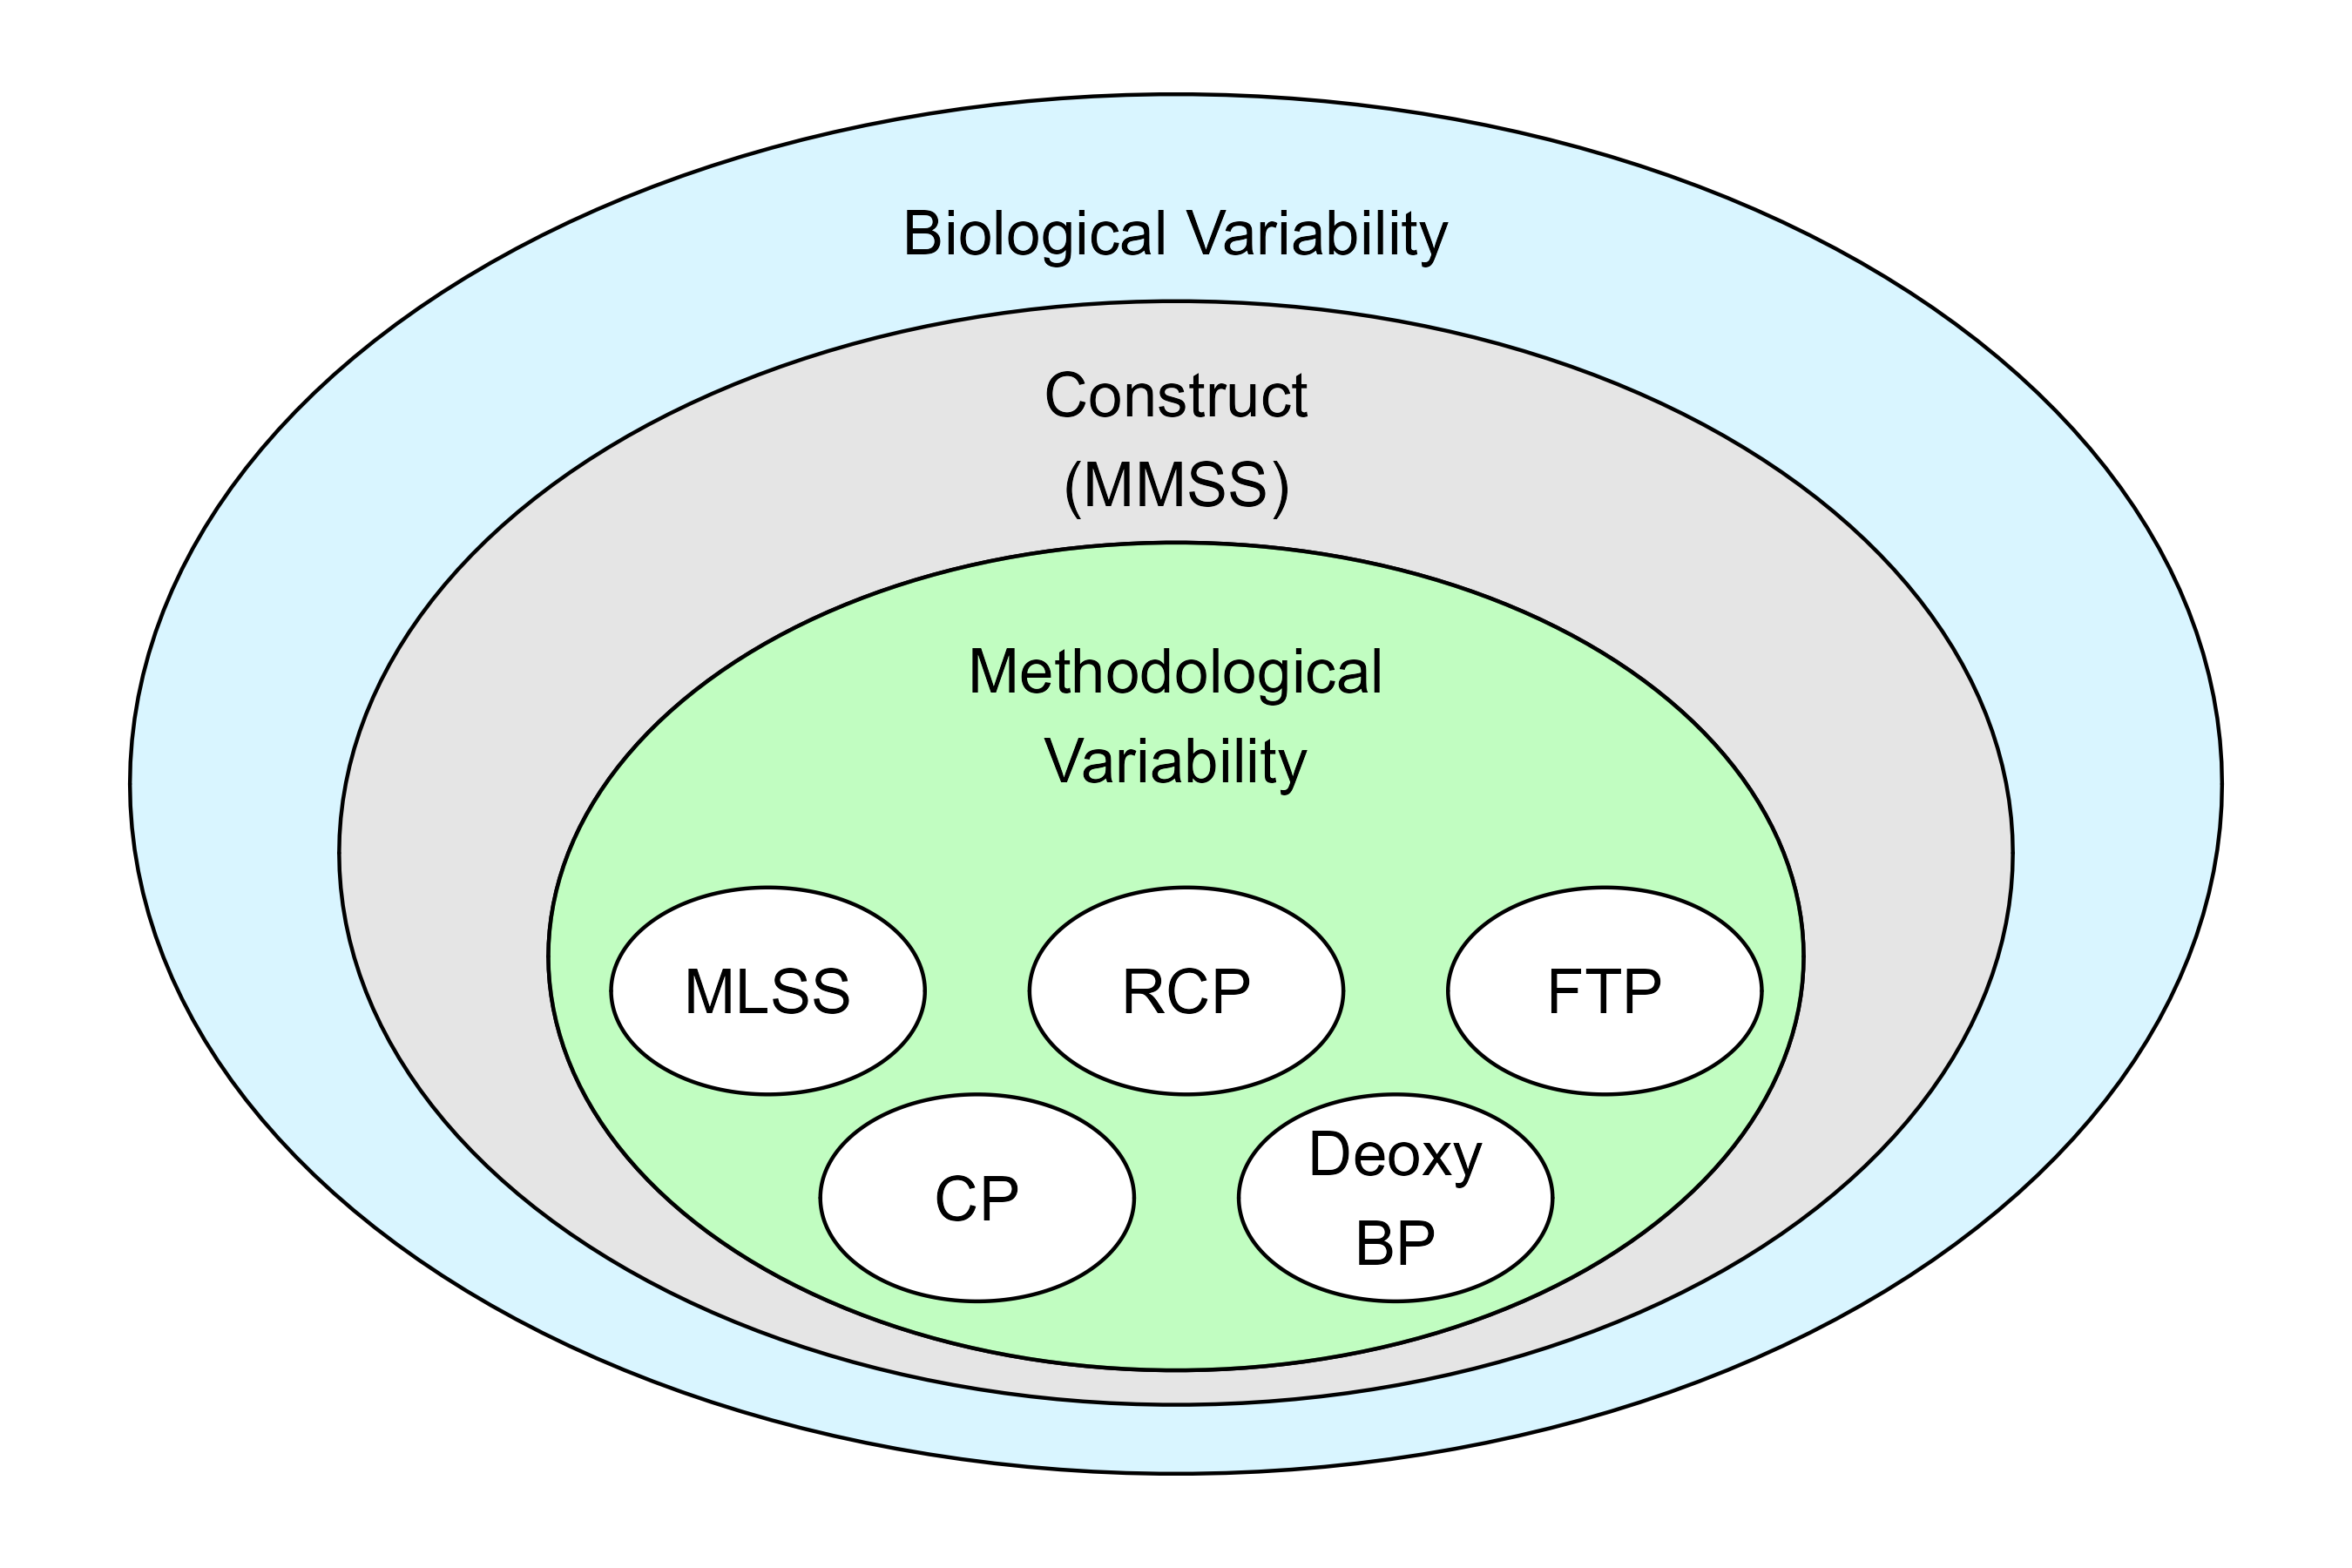
[poorly drawn] schematic representation of how biological variability underlies both the construct and measurement of thresholds, while methodological variability is specific to the particular operationalisations of threshold. Each method has trade-offs in terms of convenience, precision, flexibility, and variability.
Thus, any measurement can be said to have a confidence interval (CI), which describes the combined variability from all of these sources on the measured value. This is usually described as a 95% CI, which means that given the observed value, the ‘real value’ would be expected to be within a certain range around the observed value in 95% of repeated measurements.
Note, this isn’t saying the construct is expected to be within this range, only that the measurable (operationalised) value is expected to be within this range, given the various sources of variability. The more uncertainty or variability is in the measured value, the wider the 95% CI will be.
Of course, this is a stringent and yet arbitrary requirement based on population data. For a single individual we might be able to assume a narrower confidence interval. And for each repeated measure (for each test or each bout of a similar training session) we might be able to further tighten those error bars.
Systemic and Peripheral Thresholds
Let’s get out of the weeds a bit and discuss another recent paper that has findings related to our own, and to the point about how understanding the uncertainty around our threshold measurements can help us improve our training prescription… which I promise I’m meandering my way toward!
Caen et al, 2022. A longitudinal study on the interchangeable use of
whole-body and local exercise thresholds in cycling
Figure 5. Visualization of critical power (CP), maximal lactate steady state (MLSS), respiratory compensation point (RCP) and local thresholds within a presumed “grey zone” of exercise intensities surrounding the actual maximal metabolic steady-state (MMSS) intensity. The exact bandwidth of intensities for each threshold is defined according to their typical variation, as measured in study 1
This is a great paper taking a big step toward further understanding the association between a handful of related threshold measurements. They looked at not only agreement between thresholds within a single test, as we did, but they also looked at the test-retest reliability of each threshold measurement separately across a 4-week group of untrained females (study 1) and a 12-week group of untrained males (study 2).
This allowed them to estimate confidence intervals for any one threshold measurement based on test-retest repeated measures. As well as using the range across all measured thresholds to estimate the ‘grey zone’ around the MMSS.
Systemic Thresholds Confidence Interval
The results suggest that for these populations, systemic thresholds (CP, MLSS, RCP) are all closely related and have a high test-retest reliability. The 95% CI on the typical error of the measurement (TEM) is presented in the figure above. A TEM of 5-10 W for CP and MLSS implies that for this population, any repeated measurements would be expected to be within 5-10 W for 95% of all subjects or trials. Any less than that is ‘noise’ attributable to biological & methodological variability.
The minimum difference (MD, also known as minimal detectable change, MDC) is the minimum value by which a measurement needs to change in order to be considered a ‘real change’ in 95% of repeated measures in this population.
The wider MD interval I think of as implying by how much a measurement needs to change to be confident that not only has the measurement changed, but the underlying construct (MMSS) itself has meaningfully changed. So a MD of ≈ 20 W for CP or MLSS implies that upon re-testing, these athletes would need to have improved by 20 W in order to show a meaningful improvement in their MMSS.
This interpretation isn’t exactly true, but I find it useful to think about the overlapping layers of methodological variability that affects only the operational measurement, and biological variability which affects both the measurement and the construct.
Peripheral Thresholds Confidence Interval
The peripheral thresholds (deoxy-BP or m[HHb]-BP in the paper, and iEMG-BP) appeared to have higher variability and lower test-retest reliability, with quite large TEM of ~10-30, and MD of 40-50 W. This means for this population, to be confident of a ‘true’ change in MMSS measured by deoxy-BP for 95% of repeated measures, the change must be greater than 50 W, while their deoxy-BP itself is only ~170 W! As the authors say, “These results seriously challenge the usability of deoxy-BP and iEMG-BP for training practice.”
These local thresholds were measured at the VL muscle alone, which is the primary muscle involved in cycling, but of course not the only locomotor muscle contributing to the workload. We might explain the higher variability seen in peripheral sites as related to the effect of ‘compounding’ heterogeneities as we move from systemic to local measurements. The systemic metabolic response represents the integrated response from all local tissues of the body, thus all those various heterogeneities somewhat come out as a wash at the systemic level.
This is why we have also been interested in measuring muscle oxygenation across locomotor and non-locomotor muscle sites, and comparing to systemic responses. We hope that multiple-NIRS measurement can help explain some of this variability to provide insight into the sources of biological heterogeneities which we have been talking about, and which are certainly meaningful for understanding performance outcomes and training optimisation.
Training Prescription with Confidence
As we are able to better understand and quantify the variability – the confidence intervals – around our threshold measurement of choice, and how it relates to the construct of the MMSS, I think we can take more confidence in how we prescribe training for ourselves and our athletes, to provide the intended training stimulus more consistently.
- First, we should understand the limitations and trade-offs for our chosen testing methods. Just like peripheral measures appear to be more sensitive to variability than systemic measures, more convenient performance tests (eg. FTP) may be much more prone to error and variability than more rigorous tests and physiological outcome measures.
- We should understand that any measurement we take is affected by error and has a confidence interval around it in which the ‘true’ measurement might be expected,
- And that separately the construct which we are trying to approximate is further affected by biological variability, meaning it too has a confidence interval in which it may fall for any given test or session.
- We need to take the time to learn the range of biological variability in ourselves and our athletes. This must come from paying attention to and respecting the sensations and our internal responses to the numbers. Not from the numbers themselves.
- We should have a clear idea of what we are trying to achieve from a training session in terms of the physiological response or adaptive stimulus, in light of the current capabilities of the athlete, the demands they want to achieve, and the timeframe for achieving those goals. This is of course a far more involved subject beyond the scope for now.
By understanding the sources of variability and our potential range of responses, we will effectively narrow the error bars around our numbers as much as possible. But we need to respect that any single measurement will always have a confidence interval within which the ‘reality’ may be different from the observation, or the expectation.

Schematic representation of MMSS construct probability distribution, implying a “grey zone” within a 95% confidence interval. Associated threshold measurements have their own distributions and 95% CI.
Training zones are wide. We can give ourselves lots of room to play within them. We can be most confident that we are eliciting the intended stimulus by training somewhere in the middle of the zone, rather than at the margin. In my opinion, we should aim to prescribe our training targets such that the confidence intervals do not cross the threshold of the intensity domain we are aiming for.
It seems to me that very little is to be gained by setting our workload to eg. 5 W below our Zone 2 threshold, when the confidence interval for the ‘aerobic threshold’ construct is maybe ± 20 W (I’m making that number up). Considering, of course that as soon as we begin to turn the pedals, the physiological, psychological, and environmental milieu will drift, conspiring to gradually increase those error bars.
What’s the line about a car immediately losing 30% of it’s value once you drive it off the lot? Physiological and performance testing is similar: the results of a test immediately begin to decrease in relevance, as soon as we complete the test. The results are descriptive more than prescriptive.
Adding more information to testing can be useful (data become information only when they have been interpreted and applied appropriately… that’s another conversation). We have lots of options to gather physiological and performance information: muscle oxygenation, blood lactate, metabolic gas analysis, heart rate, power, RPE, on, and on, and on… Which brings me back to the tweetable quote from the top:
Sometimes more information gives us more precision
Sometimes more information gives us more flexibility
A structured training program needs both
Which is to say, maybe by operationalising MMSS with multiple different physiological measures we won’t get ourselves closer to knowing the ‘true’ MMSS down to the Watt. But we give ourselves more information to understand the athlete’s particular responses within a physiological range, greater ability to modify and adapt that athlete’s training in advance, and more flexibility to respond when the reality inevitably shifts away from our expectations.
