Observations
We have been performing muscle oxygenation assessments using near-infrared spectroscopy (NIRS) in cycling tests for the past few years, on a range of professional, amateur, and recreational athletes.
We have observed a few trends that are, I think interesting to consider the possible explanations for, and more importantly that have important considerations for application and training prescription.
Like any observation of physiological outcome measures, these observations come in a specific context. Most of the observations behind these trends come from evaluating muscle oxygen saturation (SmO2) at the vastus lateralis (VL), the primary locomotor muscle in cycling, with Moxy NIRS sensors. We have evaluated female and male cyclists over a range of athlete classification criteria: ie. across fitness, training status, and performance levels.
The assessment protocol we used was a ‘5-1’ intermittent step test, with 5-minute constant workload stages separated by 1-min rests. We collected SmO2 from Moxy on the VL and other muscles, although for now we will focus on the response profile in the VL.
The data I show below come from a controlled study we recently performed, which is so-far unpublished and therefore not yet peer reviewed and validated, but which will (hopefully) soon be published in more detail. now published. See my summary and links to the article here.
Let’s look at a representative subject
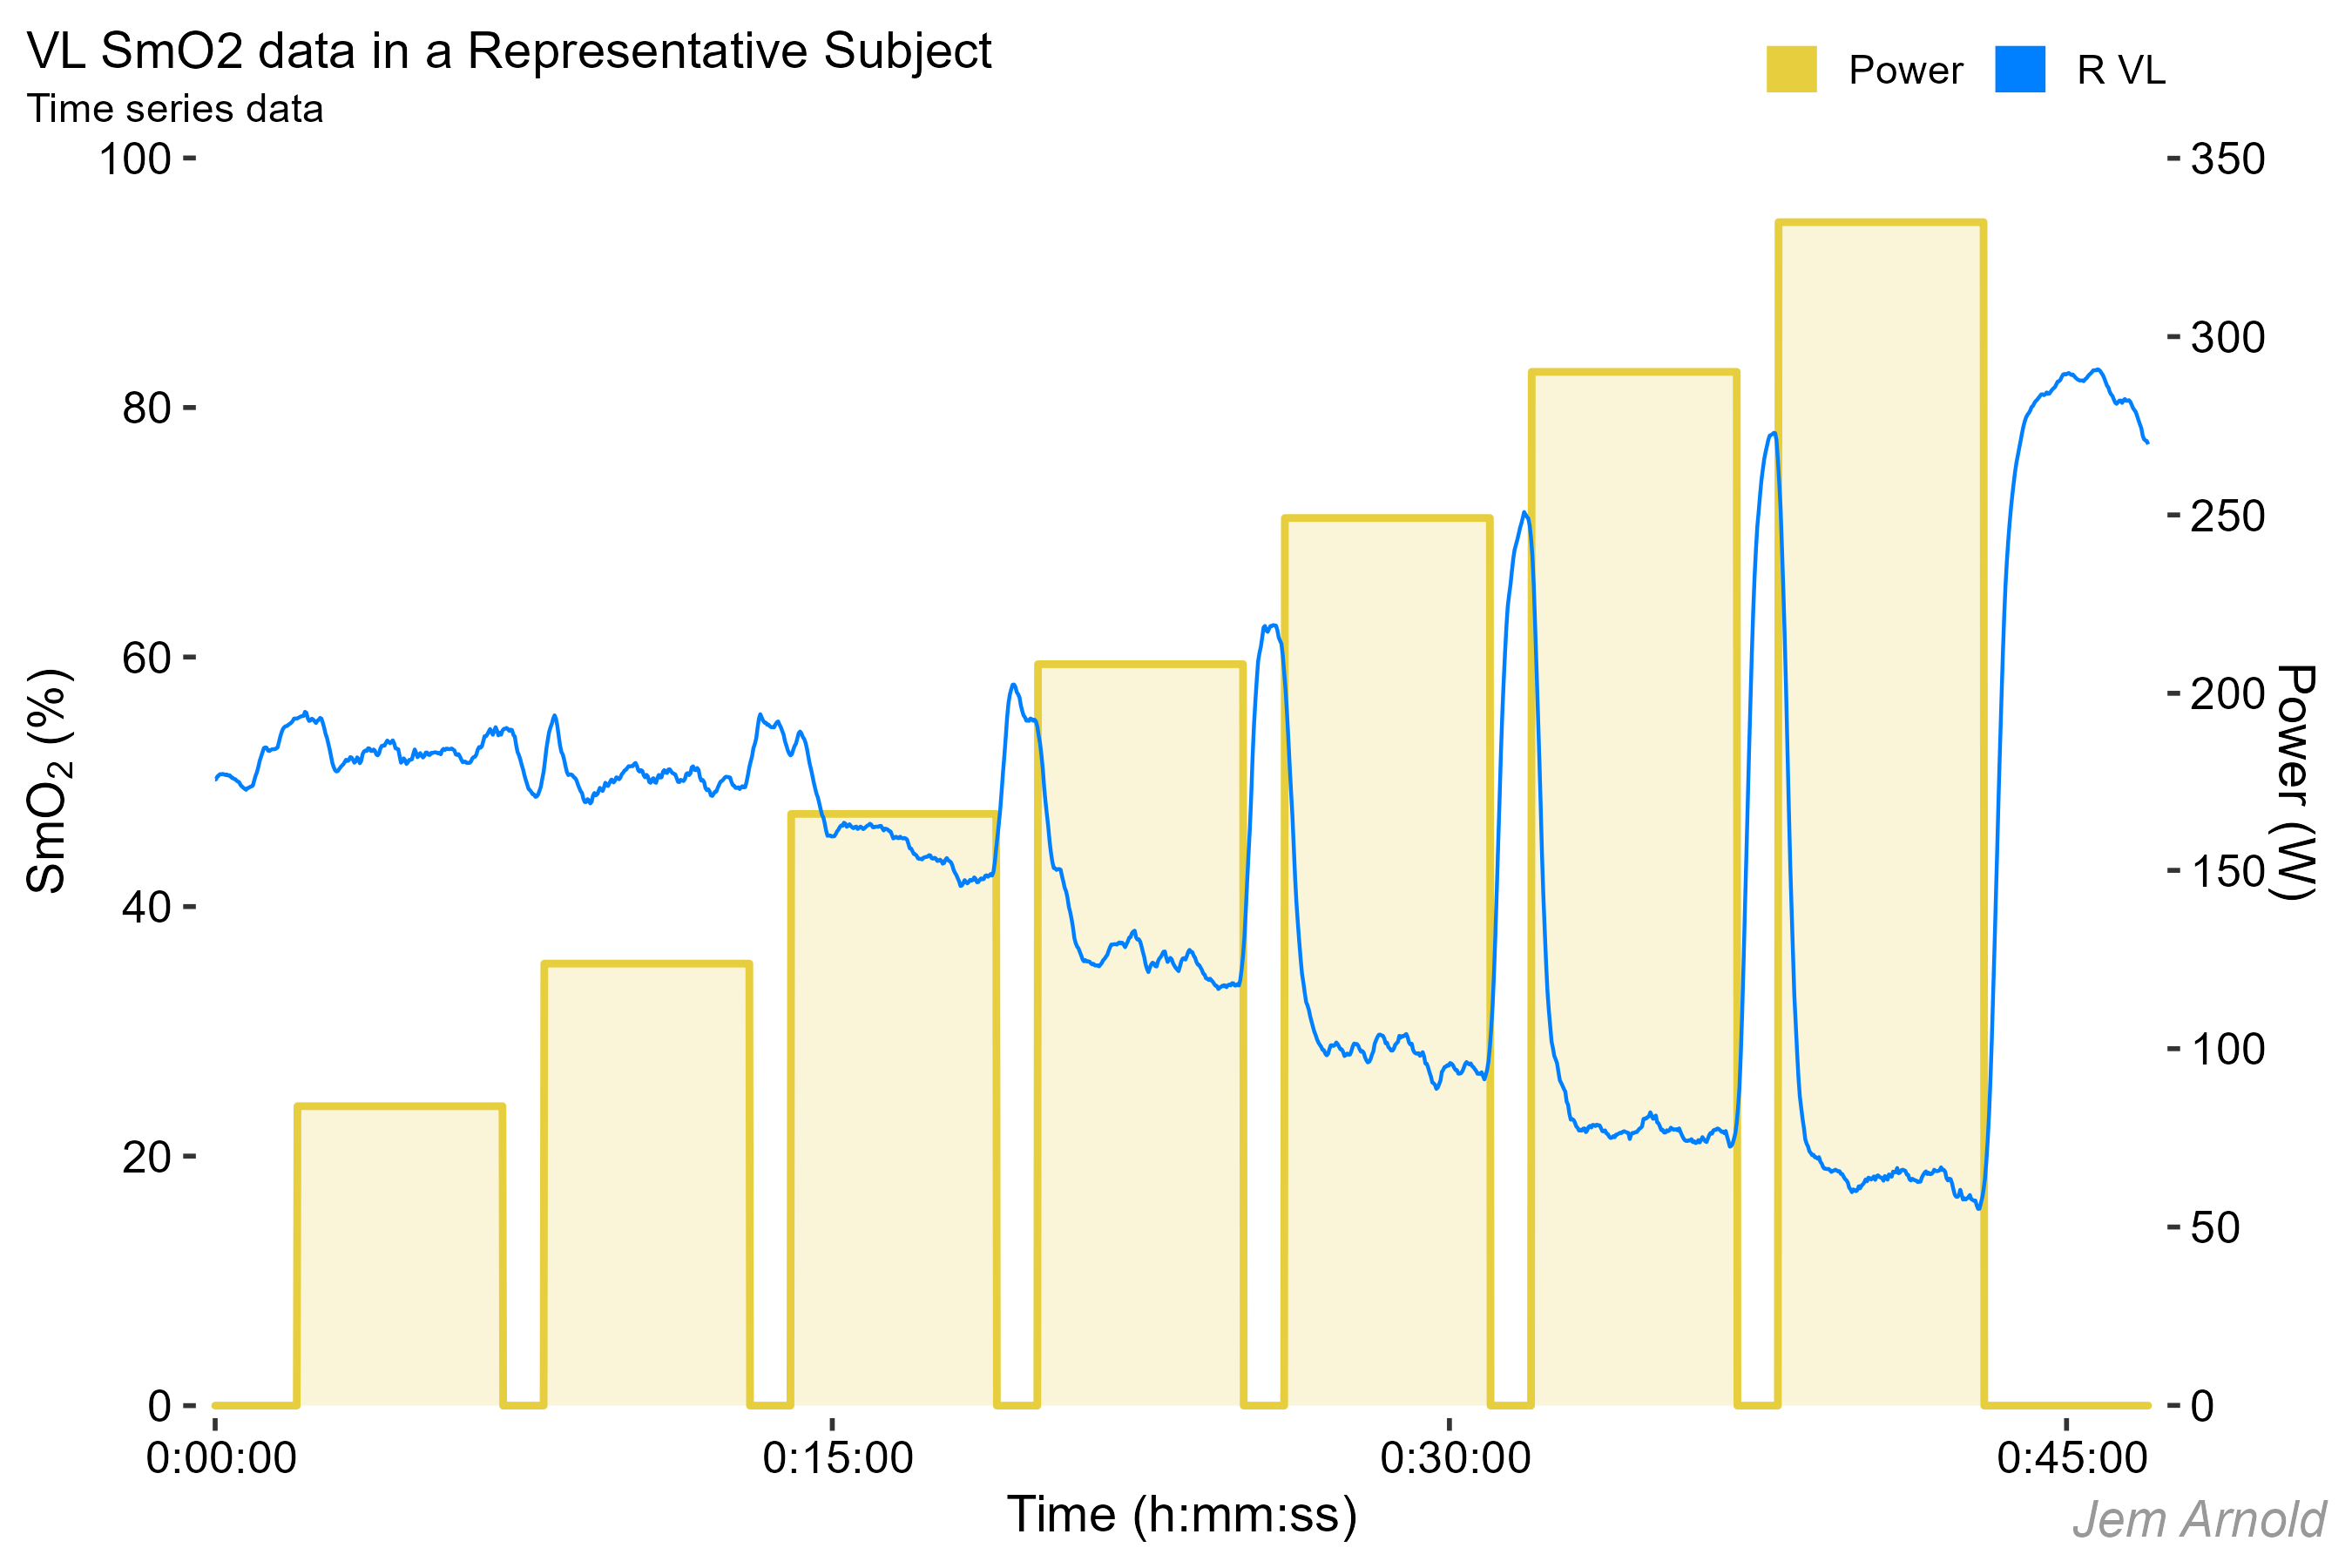
This is what a typical 5-1 assessment might look like. This particular subject is a male amateur, trained cyclist.
Time is on the x-axis
Power (watts) is on the right-side -axis
SmO2 (%) values are on the left-side y-axis
The power output is shown in yellow. SmO2 at the VL is in blue
For this discussion we are primarily interested in the SmO2 values during each work stage. We will be ignoring the recovery kinetics between stages for now.
The SmO2 in the final minute represents the ‘steady-state’ muscle oxygenation, as muscle O2 delivery (mQ̇O2) and uptake (mV̇O2) have reached a relative balance to meet the energetic demands of the workload.
We could plot a smoothed trendline through the end-stage SmO2 data to already observe the oxygenation response profile as a function of increasing intensity for this subject.

Note the trendline is curvilinear, with some transitions where deoxygenation deflects more negative (steeper downward slope) or less negative (less steep, nearly flat slope).
If we want to compare across a larger group of subjects, we will need to simplify and transform these data. We do that by calculating an end-stage mean SmO2 value for each stage, in each trial.
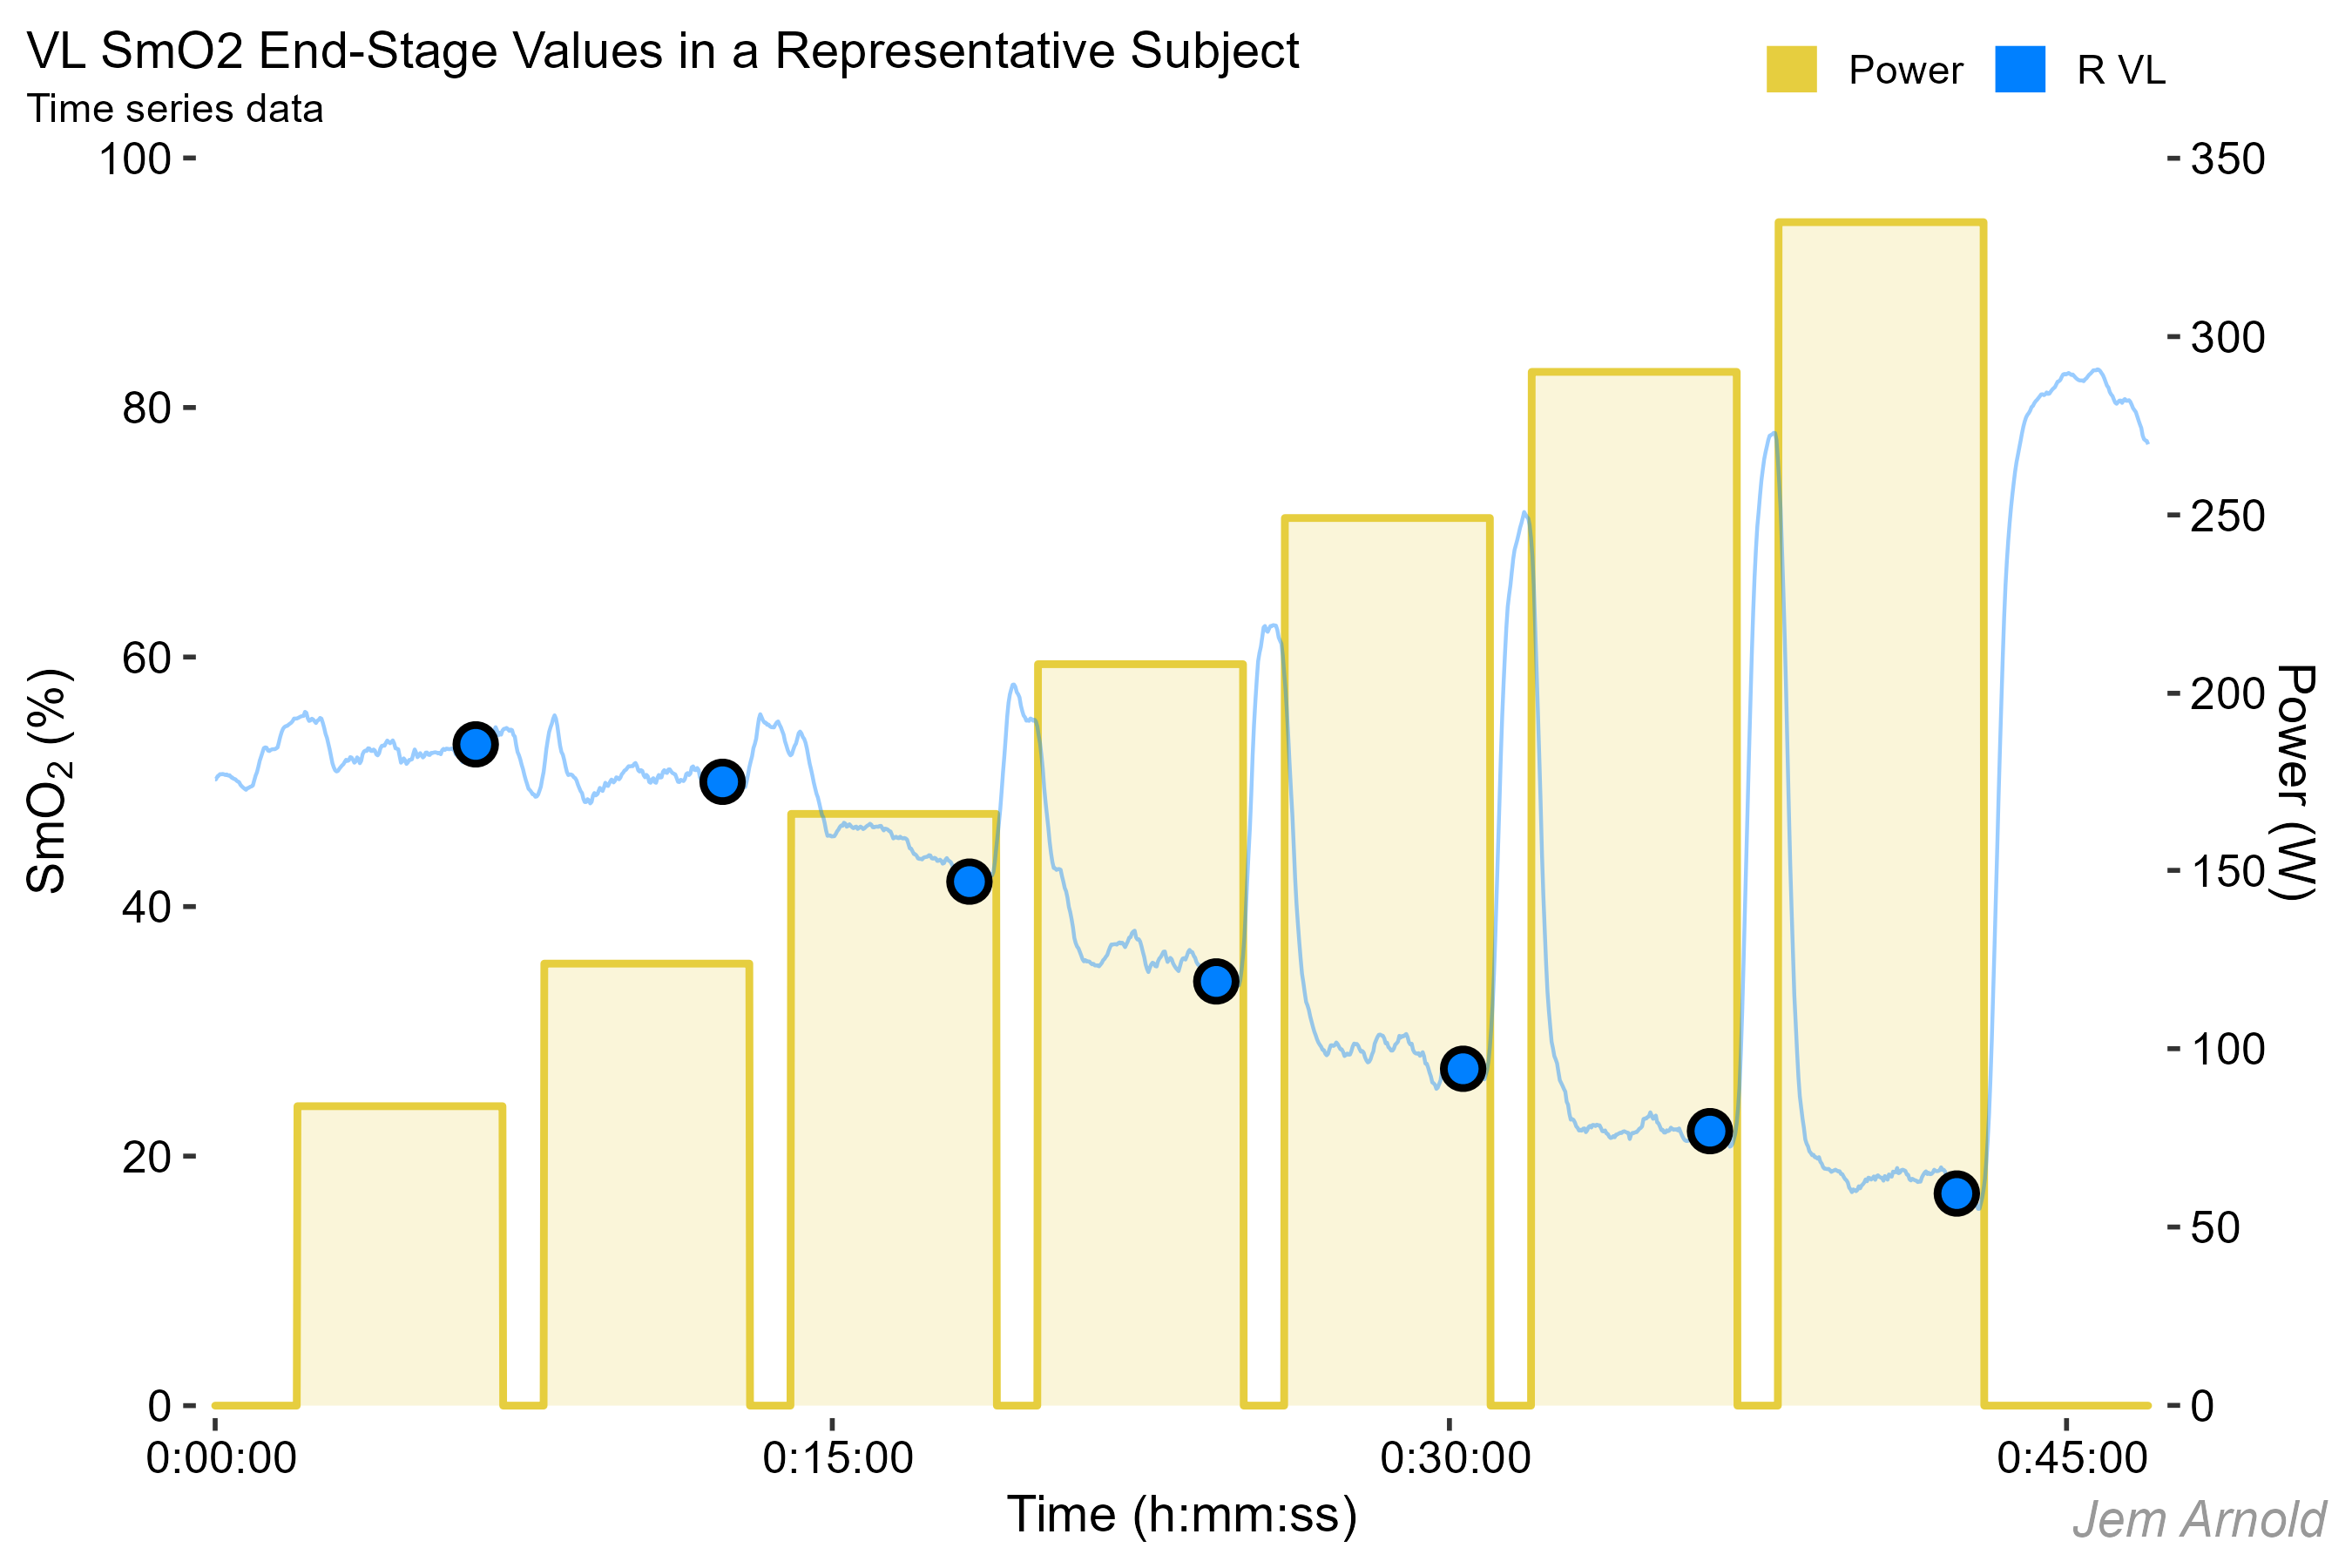
The mean of the last minute of each workload is taken as a single data point for each stage, shown here on the raw time series data. This will be simplified into discrete stage values shown below.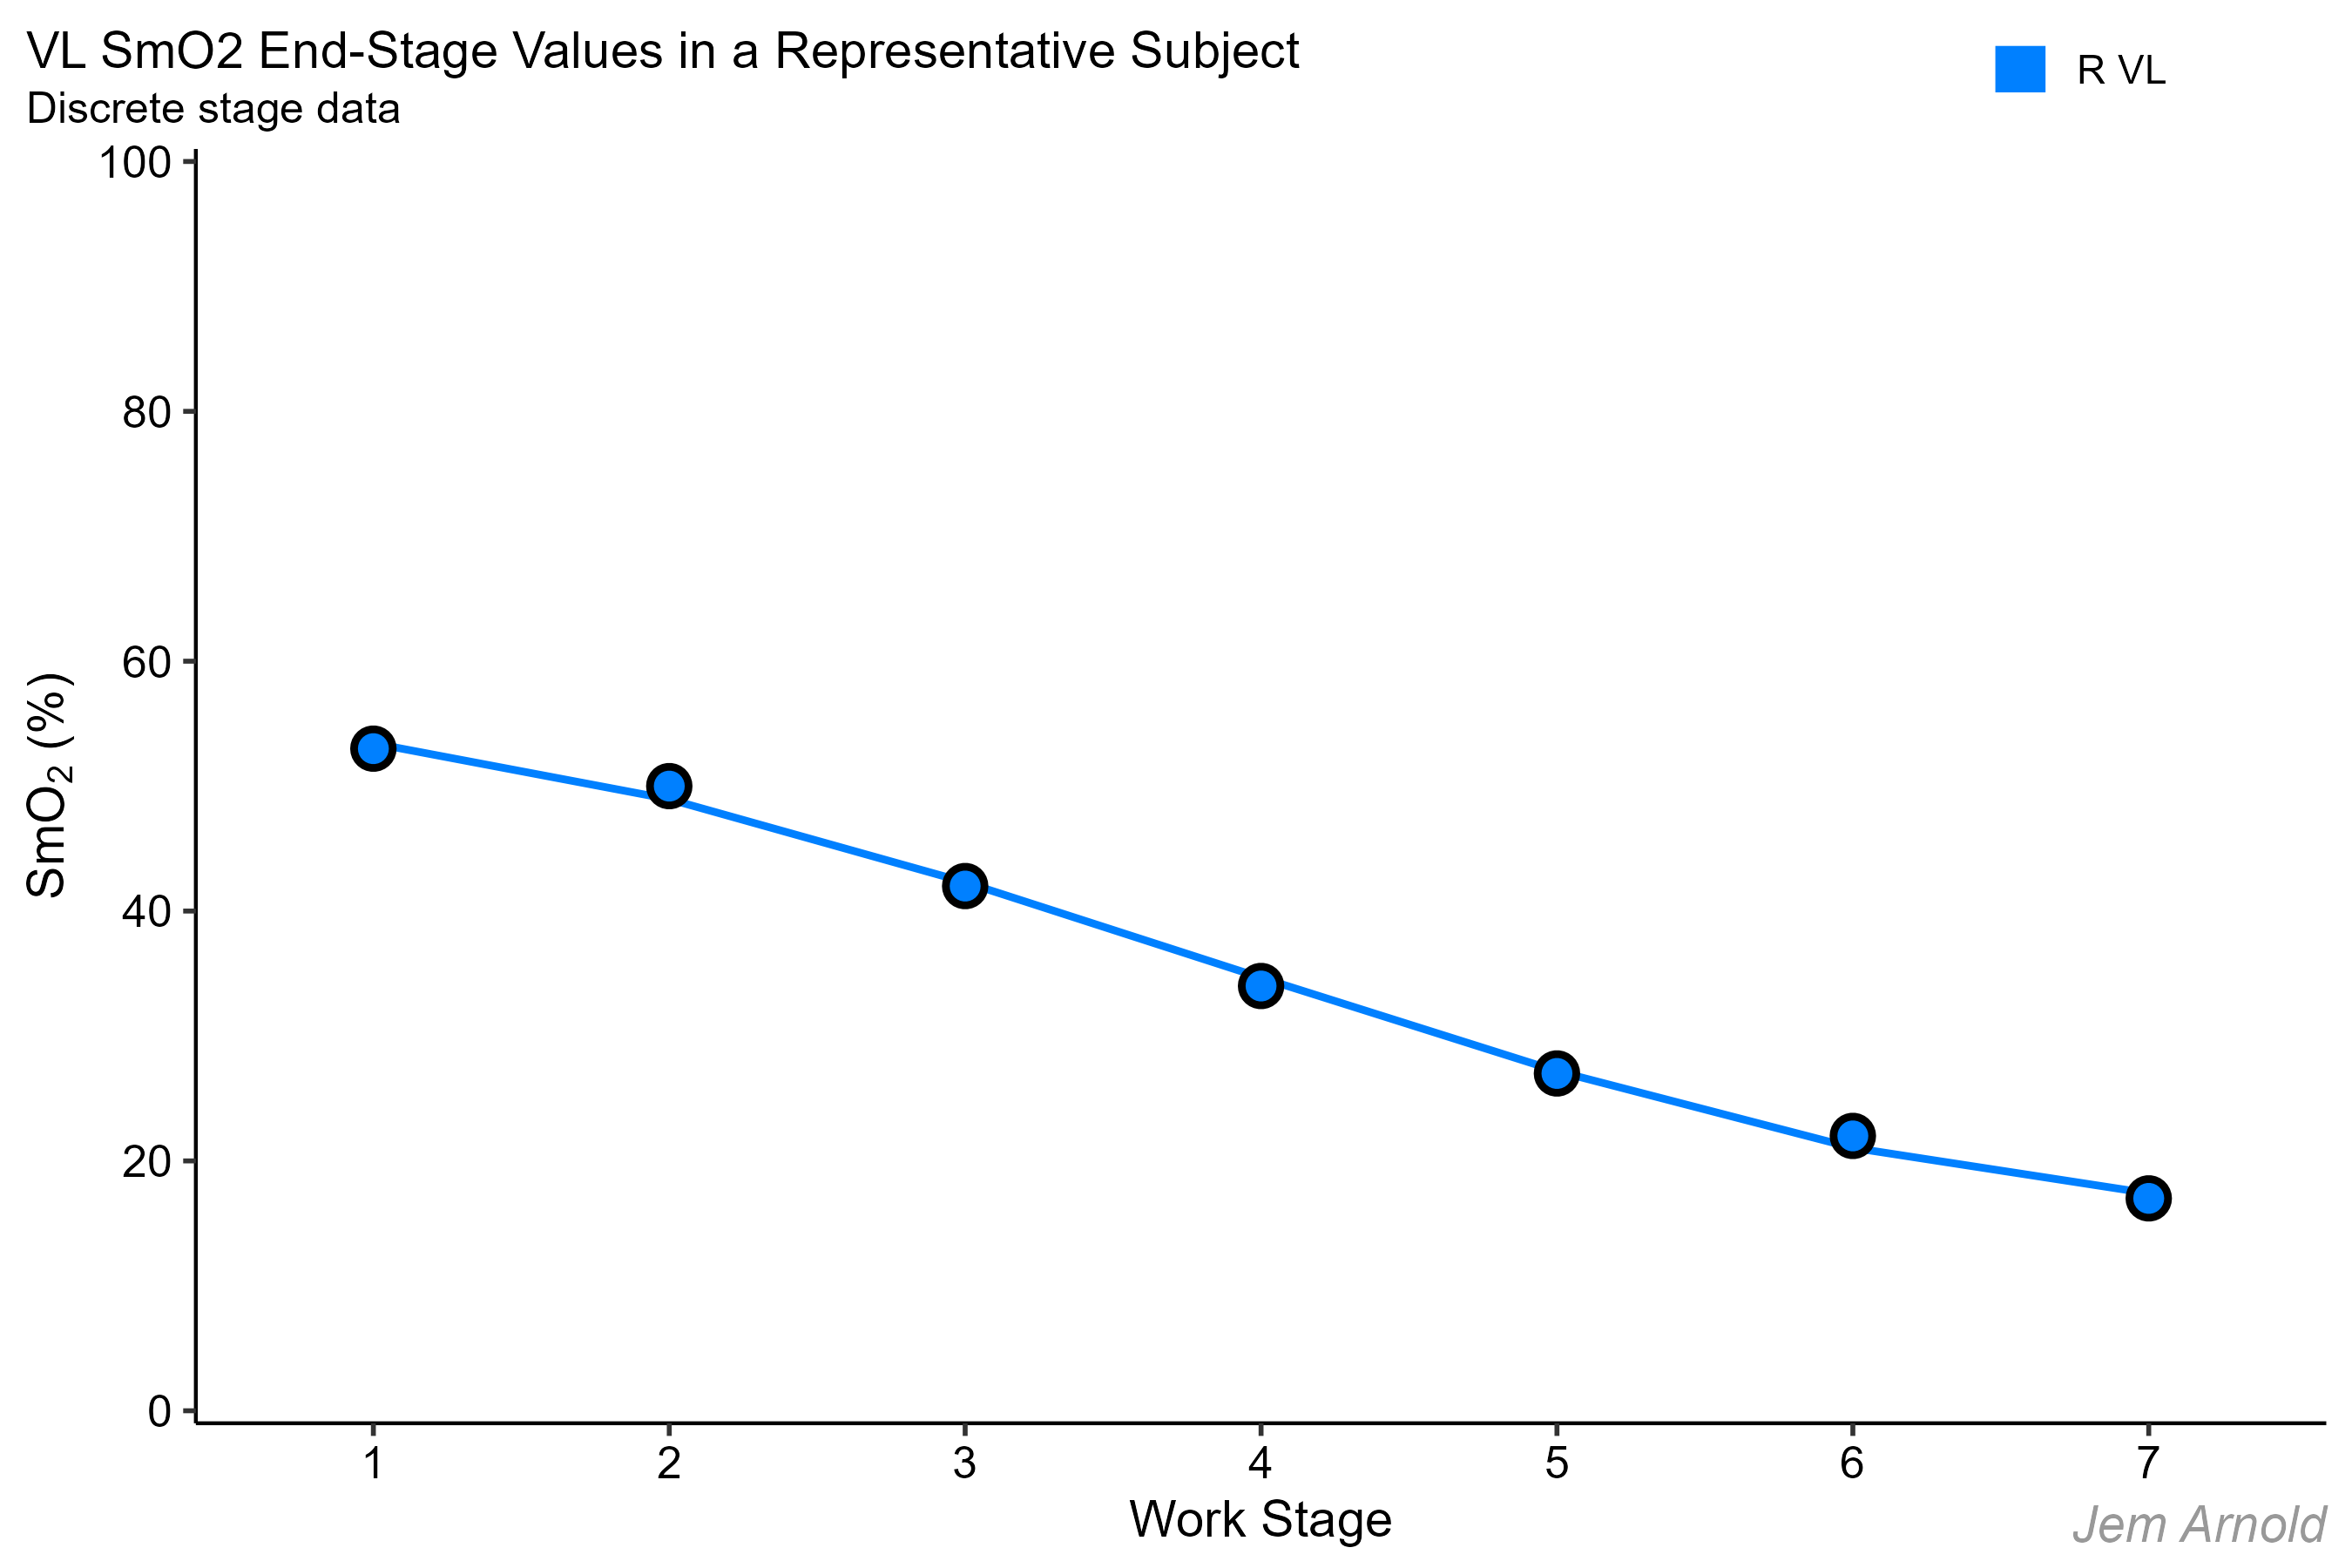
These same end-work mean SmO2 values can be re-plotted in a simplified figure.
Stage number on the x-axis
SmO2 (%) on the y-axis
We perform this transformation across all of our subjects and plot them on a common chart. To compare across subjects with a wide range of fitness levels, who may have completed anywhere from 6 to 10 work stages, we normalise the stage workloads to each subject’s peak workload (Wpeak). This gives us a scale of relative workload from 0 to 100%.

Each subject’s individual end-stage mean SmO2 values plotted as lines on a scale of relative workload
Relative workload (%) on the x-axis
SmO2 (%) on the y-axis
First thing we can see is that the lines are all over the place, basically across the entire SmO2 scale from 0-100%. So there is clearly a very wide between-subjects variability in the oxygenation response profiles that should be appreciated.
I think it is inappropriate in this case to make much of any interpretation of the ‘group mean’ response profile, since the error bars basically stretch across the entire plot.
After spending quite a lot of time looking at individual and group response profiles, we felt that we could identify two general ‘shapes’ of the SmO2 curves that subjects would fall into. Let’s highlight those now.
In the first group we are highlighting, SmO2 shows an obvious rise at lower workloads to a maximum, before decreasing at higher workloads. These subjects follow a parabola-shaped oxygenation profile with increasing intensity.
In the second profile, SmO2 appears to more consistently decrease as workload increases toward peak. This is called ‘monotonic’, meaning in this case that SmO2 is lower at each increase in workload.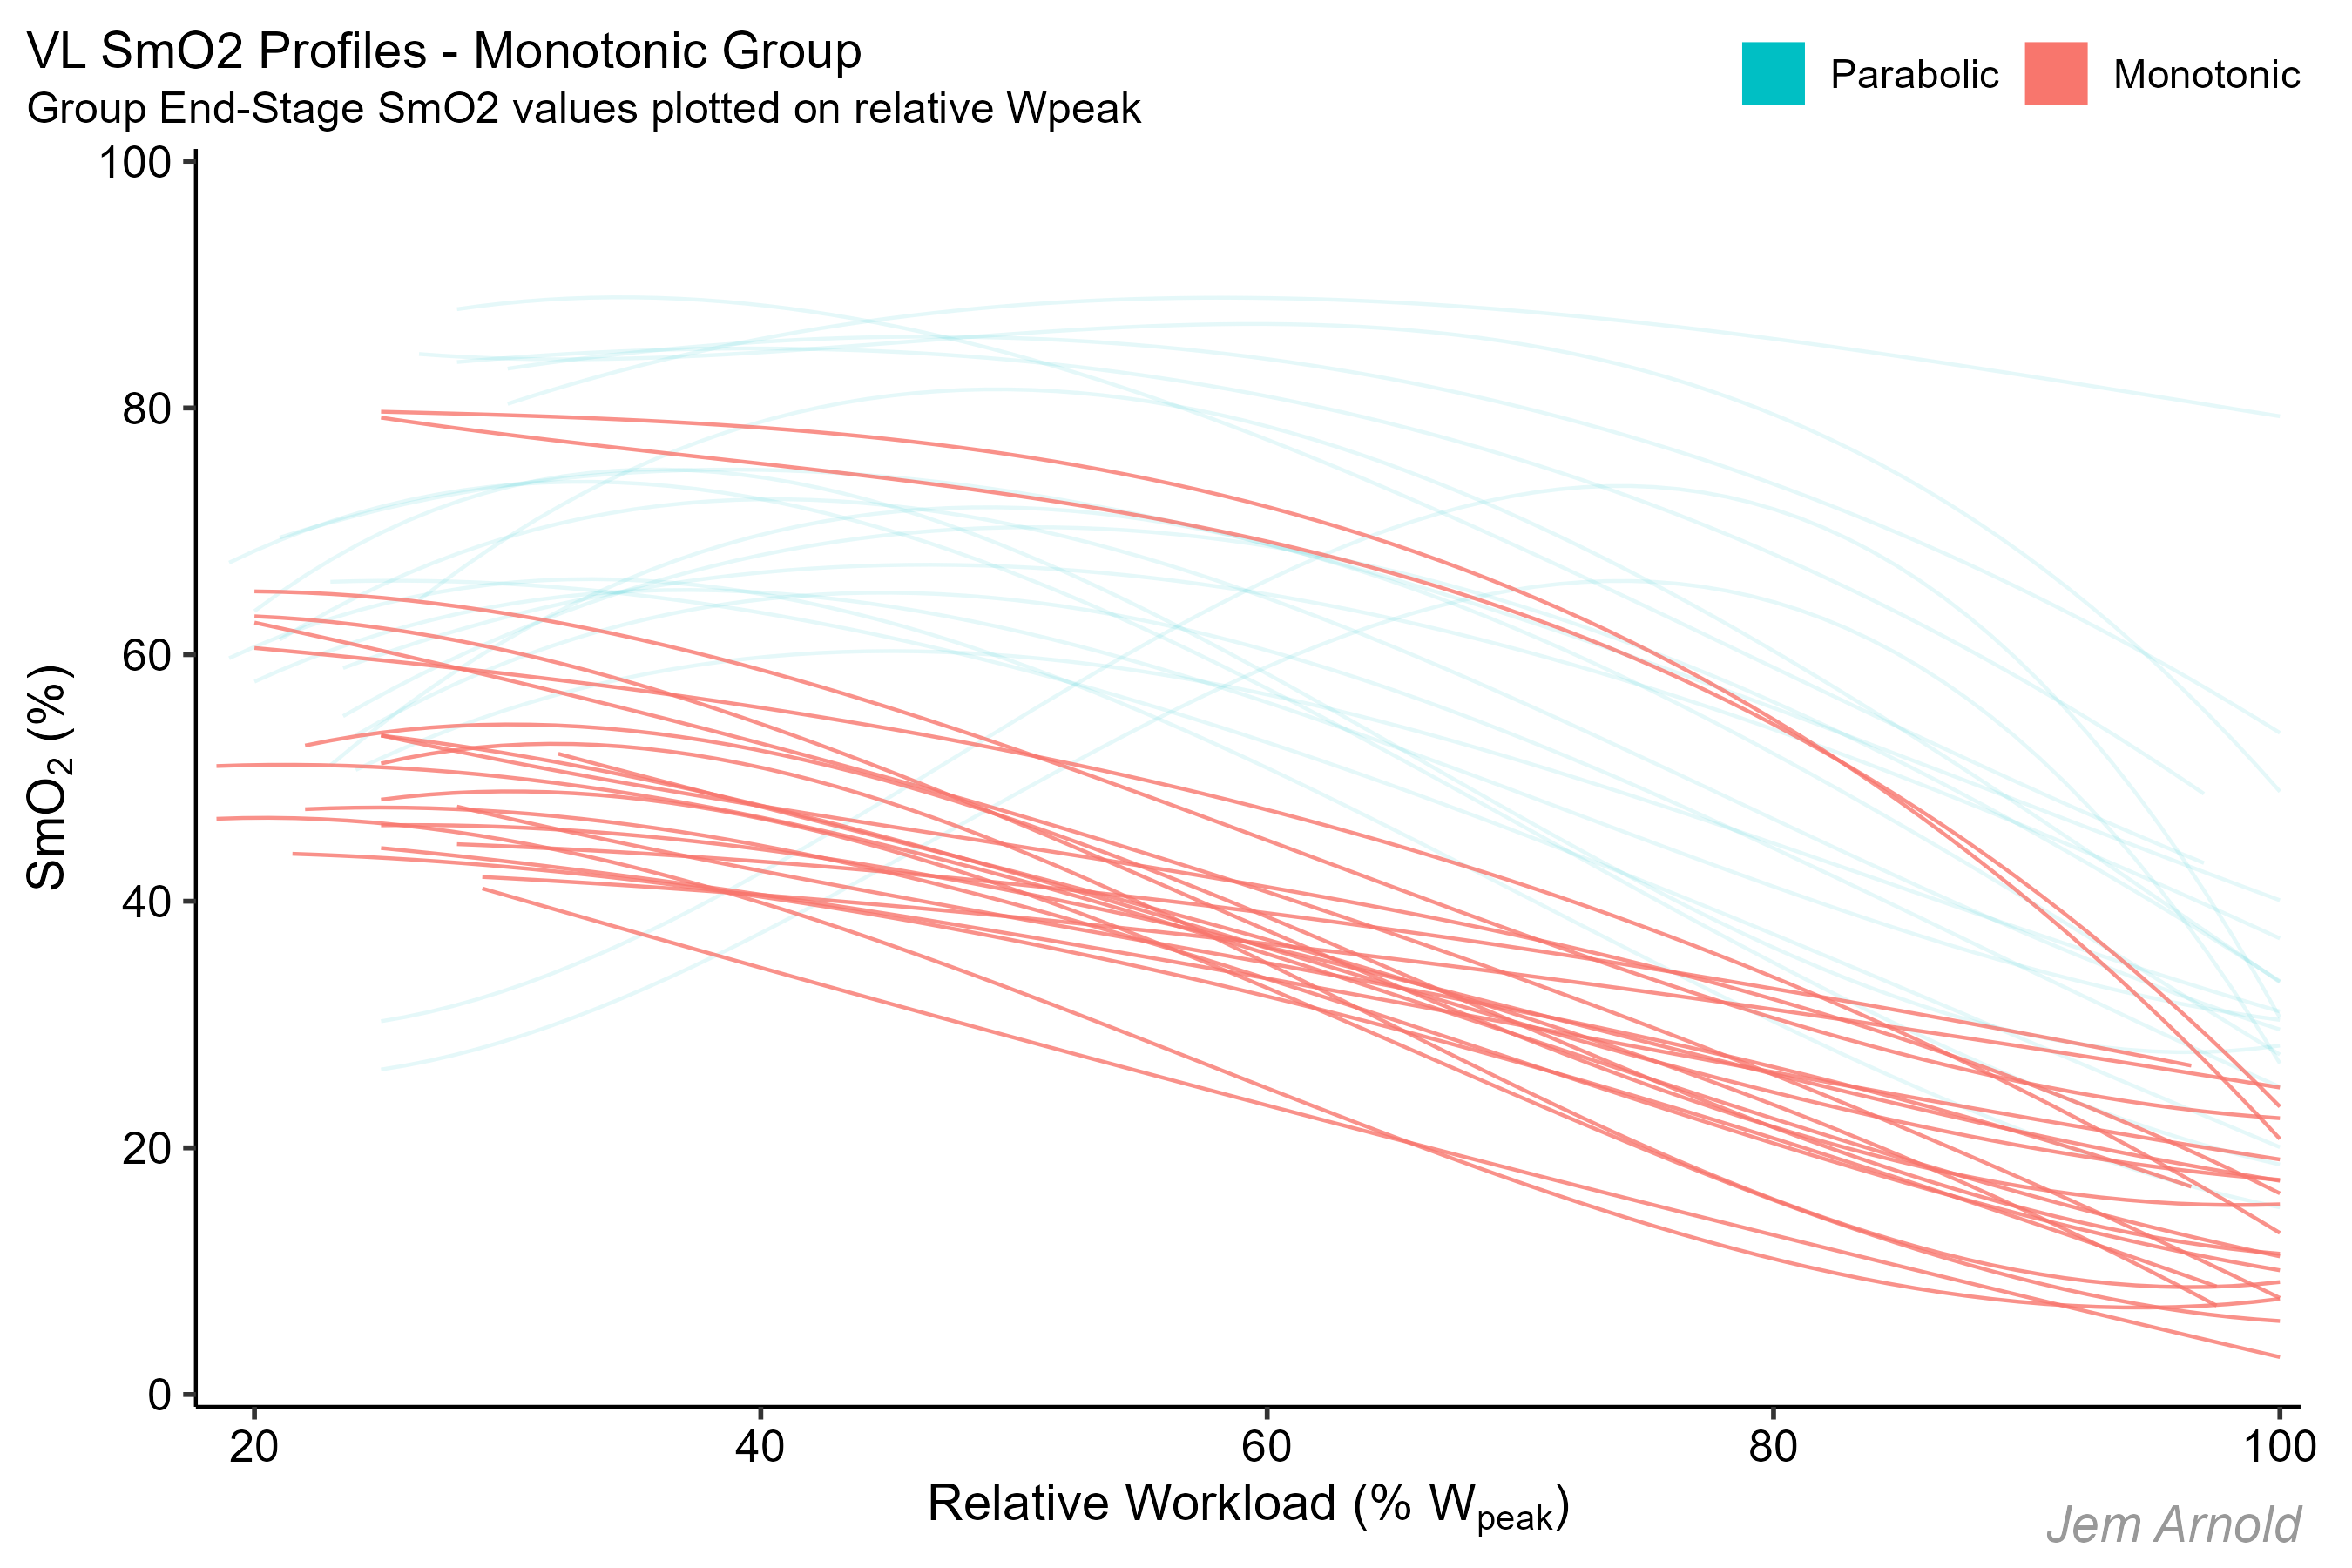
Knowing nothing else about these subjects apart from visually categorising their oxygenation response profiles as ‘monotonic’ or ‘parabolic’, we can compare the two groups to determine whether the response profiles are statistically different.
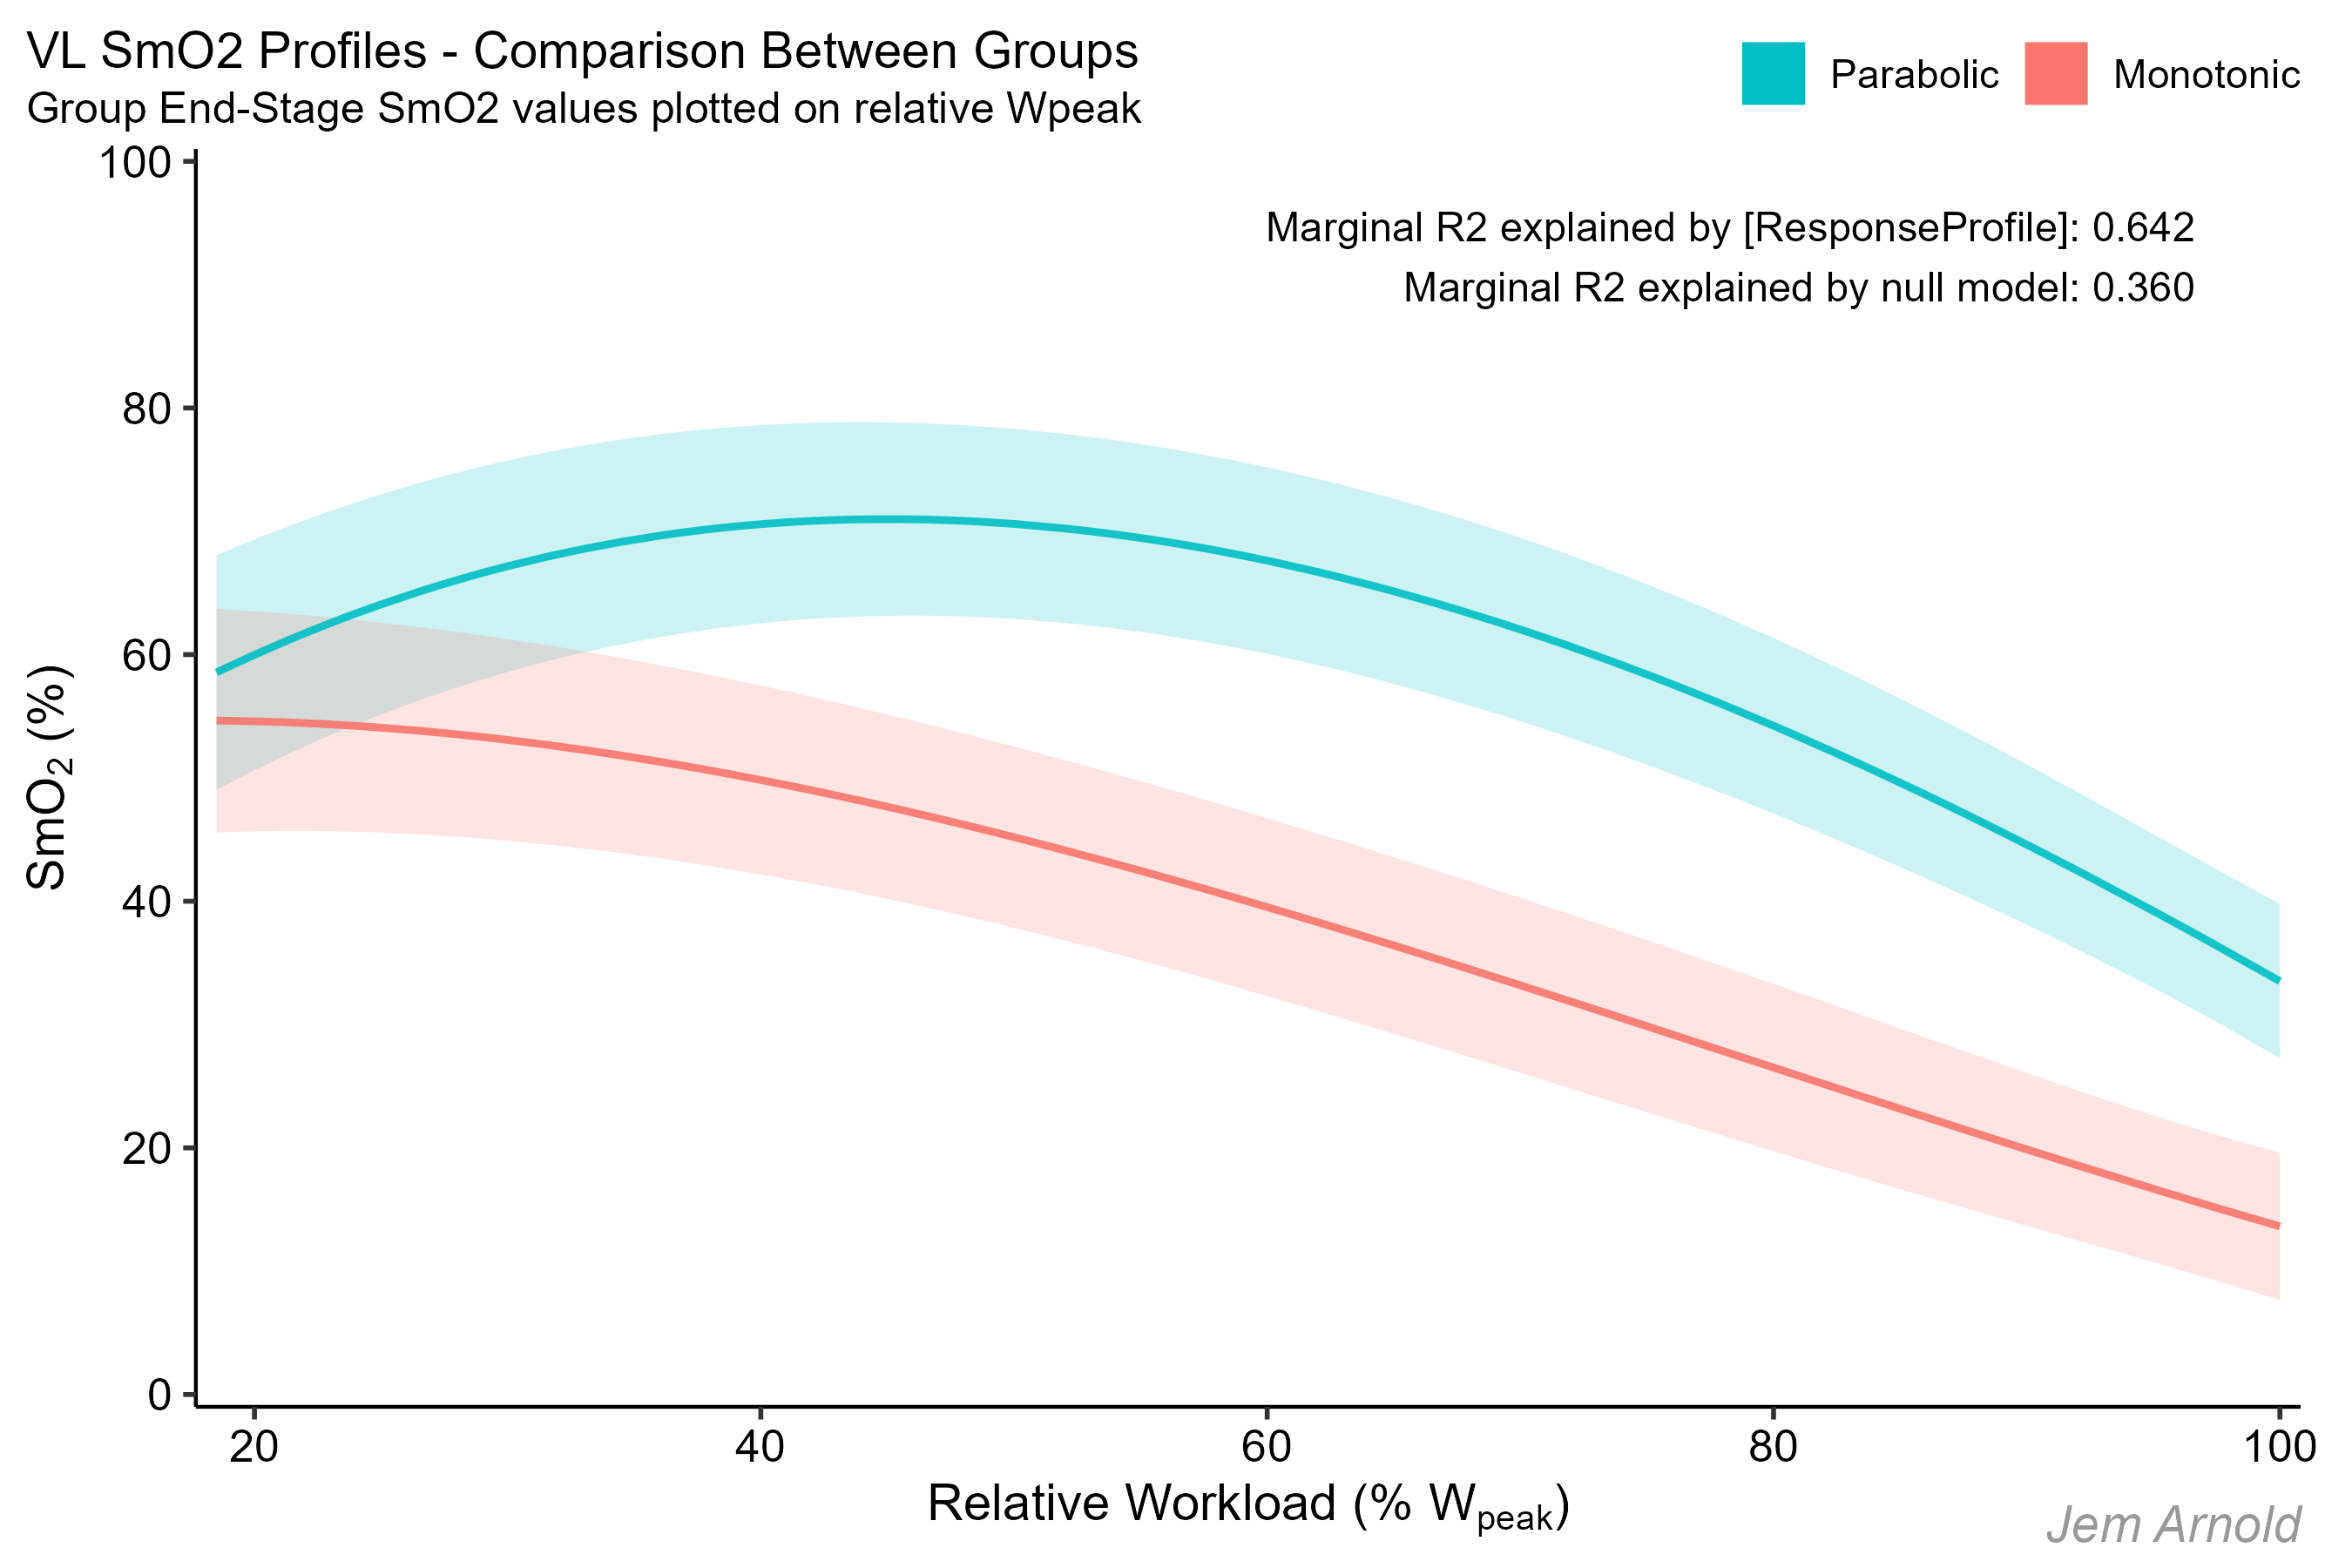
Indeed, when fitting the group data to a mixed linear model, the null model (considering all subjects together) only explains around ⅓ of the total variance (which is predominantly related to between-subjects variability).
While the addition of the categorical [ResponseProfile] parameter to the model has double the explanatory power, nearly ⅔ of the total variance.
Basically this means that compared to running a single trendline through the entire dataset, running two trendlines through each oxygenation response profile group is about twice as good at predicting the dataset. Which is to say, the two response profiles are substantially different.
(forgive me for being very handwavy with the statistical language here, as this is a very preliminary, exploratory analysis not intended for validation)
What do we know about the subjects who fall into each response profile?
Without making any statistically robust assertions quite yet, I can say anecdotally that subjects with a more parabolic oxygenation profile at the VL tend to be some combination of:
- Lower fitness and training status
- Less lean body composition, higher skinfold thickness over the VL
- Smaller muscle mass
- Higher slow twitch muscle fiber predominance
- Generally more ‘oxidative’ phenotype
Subjects with a more monotonic oxygenation profile at the VL tend to be:
- Higher fitness and training status
- Leaner, lower skinfold thickness over the VL
- Larger muscle mass with higher intramuscular pressures
- Higher fast twitch muscle fiber predominance
- Generally more ‘glycolytic’ phenotype
None of these characteristics are exclusive. These two oxygenation response profiles are not binary, but represent two extrema along a spectrum.
Many of these characteristics also fall along female / male sex differences. Females tend to show a parabolic oxygenation response profile more often than monotonic, and males show monotonic more often than parabolic. But I think it’s more useful to consider the characteristics that directly affect the NIRS signal, rather than group the empirical responses as based on sex alone.
Theory
Myself, Andri Feldmann, and others have brainstormed the mechanistic factors for these oxygenation response profiles, and I think we have some good – although at this point unvalidated ideas. Where our opinions diverge is mostly to do with the relative magnitude of effect each factor has on the overall signal.
Sean at Upside Strength and I have also discussed these response profiles a couple times, with more visual explanations in his video podcast.
This section will just be a speculative wall of text walking through some nuances of NIRS signal interpretation. Feel free to skip to the application at the end if you’re more interested in why these oxygenation profiles matter at all in sport science!
Let’s briefly discuss some of these factors as they relate to the anecdotal subject characteristics I proposed above.
The first factor that I think may have the largest contribution to the oxygenation response profile is the tissue composition under the sensor, primarily the contribution of skin and subcutaneous adipose tissue.
We have to consider that the near-infrared optical wavelengths used by Moxy only penetrate around ~13 mm of depth into the tissue. Even for the most lean professional athletes around a third of this depth will be composed of skin, subcutaneous fat, fascia, and other tissues that are less metabolically active than muscle.
Some portion of the SmO2 signal is resolved from these tissues. Athletes with higher skinfold thickness, especially female athletes who tend to have higher regional skinfold thickness at the thigh, will then resolve less signal from muscle, and more from these superficial tissue layers.
Briefly, Moxy uses an algorithm to weight the signal contribution toward the greatest penetration depths, thus calling the signal muscle oxygen saturation. While other devices such as the Train.Red sensors we have been using recently return a more equally weighted signal across tissue depth, and thus use the term tissue saturation index (TSI). Although it is then possible to select each signal depth independently, e.g. to manually filter out the superficial-most layers. There are pros and cons to both methods.
If we consider the metabolic activity across tissue depth, we know that muscle is far more metabolically active than adipose tissue and skin. However skin is densely vascularised and will have high blood flow for the purpose of thermoregulation.
During exercise, blood flow and O2 delivery will tend to increase toward all tissues, however only muscle will extract a meaningful portion of that oxygenated blood volume. Thus, to a first approximation lower skinfold thickness implies greater measured volume of muscle relative to skin & adipose tissue, which will extract a greater relative portion of oxygen and produce greater deoxygenation (lower SmO2 measurements).
So lower skinfold thickness will tend to produce a more monotonic oxygenation response profile, while in higher skinfold thickness, warm-up hyperemia will tend to increase O2 delivery more than O2 uptake at lower workloads, resulting in a parabolic profile.
That’s the simple metabolic story, but there is a mechanical story to consider as well. At the onset of muscle contraction and with leg movement during cycling, the tissue volume that is measured by NIRS effectively changes, and intramuscular pressures will push blood volumes in and out of the area of illumination.
Furthermore, the spatial balance along a typical capillary may shift in either direction between more venous, or more arterial blood volume. Thus, oxygenation is not only dependent on metabolic O2 delivery & uptake (mQ̇O2 & mV̇O2, respectively), but also on mechanical hemodynamic forces that change the effective blood volume under the sensor from sample to sample.
This is speculative, but I wonder if athletes with larger muscle mass and lower skinfold thickness, generating higher intramuscular forces and thus higher vascular resistances during contraction, with less ‘low resistance’ superficial tissue, will tend to push blood volume out of the superficial tissue volume? While athletes with smaller muscle mass and higher skinfold thickness will tend to push more blood volume into the area of illumination?
Or said another way: the parabolic oxygenation profile could be related to the mechanical/hemodynamic accumulation of oxygenated arterial blood volume in the superficial tissues, in excess of the metabolic O2 extraction occurring in the deeper layers at lower workloads.
While the monotonic oxygenation profile could be related to relatively higher mechanical forces occluding blood flow and tending to accumulate deoxygenated venous blood volume in the tissue volume under illumination.
This brings us to the next factor which is muscle fiber composition and general tissue phenotype. Between predominantly slower-twitch, smaller fibers with higher density of mitochondria and capillarisation, in smaller motor units. And larger, faster-twitch fibers with less capillarisation & mitochondria, higher glycolytic capacity, organised into larger motor units.
More oxidative phenotype muscle tissue tends to have a higher ratio of mQ̇O2 to mV̇O2 until approaching maximum convective O2 delivery and %O2 extraction. This means more aerobic overall muscle may tend to show a more parabolic oxygenation profile as the balance of mQ̇O2 to mV̇O2 increases at lower workloads, before reaching a maximum and subsequently O2 extraction begins to exceed delivery at higher workloads.
It is worth mentioning that within the quadriceps, superficial muscle tends to be more glycolytic, and deeper fibers tend to be more oxidative. So regardless of overall muscle phenotype, we will be measuring more glycolytic fibers in the superficial VL with NIRS. This also means that %O2 extraction will tend to be lowest in the superficial tissues above the muscle, then high in the superficial muscle layers, and decrease again toward the deeper muscle.
So I would propose that an athlete’s oxygenation response profile primarily depends on these interacting factors:
where less lean athletes, with higher-skinfold thickness, smaller muscles, but who are also highly aerobically trained, and with highly oxidative-predominant fiber phenotypes may show the most parabolic SmO2 profile.
While leaner, larger muscled, highly trained but more glycolytic-predominant athletes may show the most monotonic SmO2 profile. Then, athletes who fall into some combination of these metabolic & mechanical features will demonstrate an oxygenation profile somewhere between the two extremes.
Application
Why should we care about these two oxygenation response profiles?
I recently spoke with Mikael on That Triathlon Show about some of my work using NIRS in research & coaching. We briefly spoke about how understanding these oxygenation response profiles can help to understand a particular athlete’s physiological strengths & limiters, and how they might respond to a training intervention.
We also mentioned that trying to evaluate how training zones or physiological intensity domains derived from NIRS are related to other traditional measures of blood lactate (BLa) or ventilation & gas exchange, are strongly depended on, and divergent between these two profiles.
That is, an SmO2 signal that may be interpreted as associated with, say LT1 in one response profile, may not correspond to the same intensity – or may not exist at all – in the other response profile.
One of the examples we spoke about compared the first lactate threshold (LT1) or the power output at FatMax to an associated NIRS-derived breakpoint (SmO2max, in this case) for low-intensity training prescription. In parabolic athletes, there is a hint of an association (that has not been robustly validated yet) between FatMax / LT1 and the maximum SmO2 plateau (the top of the parabola).
SmO2max paired measures with LT1; operationalised as log-log LT in subjects with a parabolic oxygenation profile.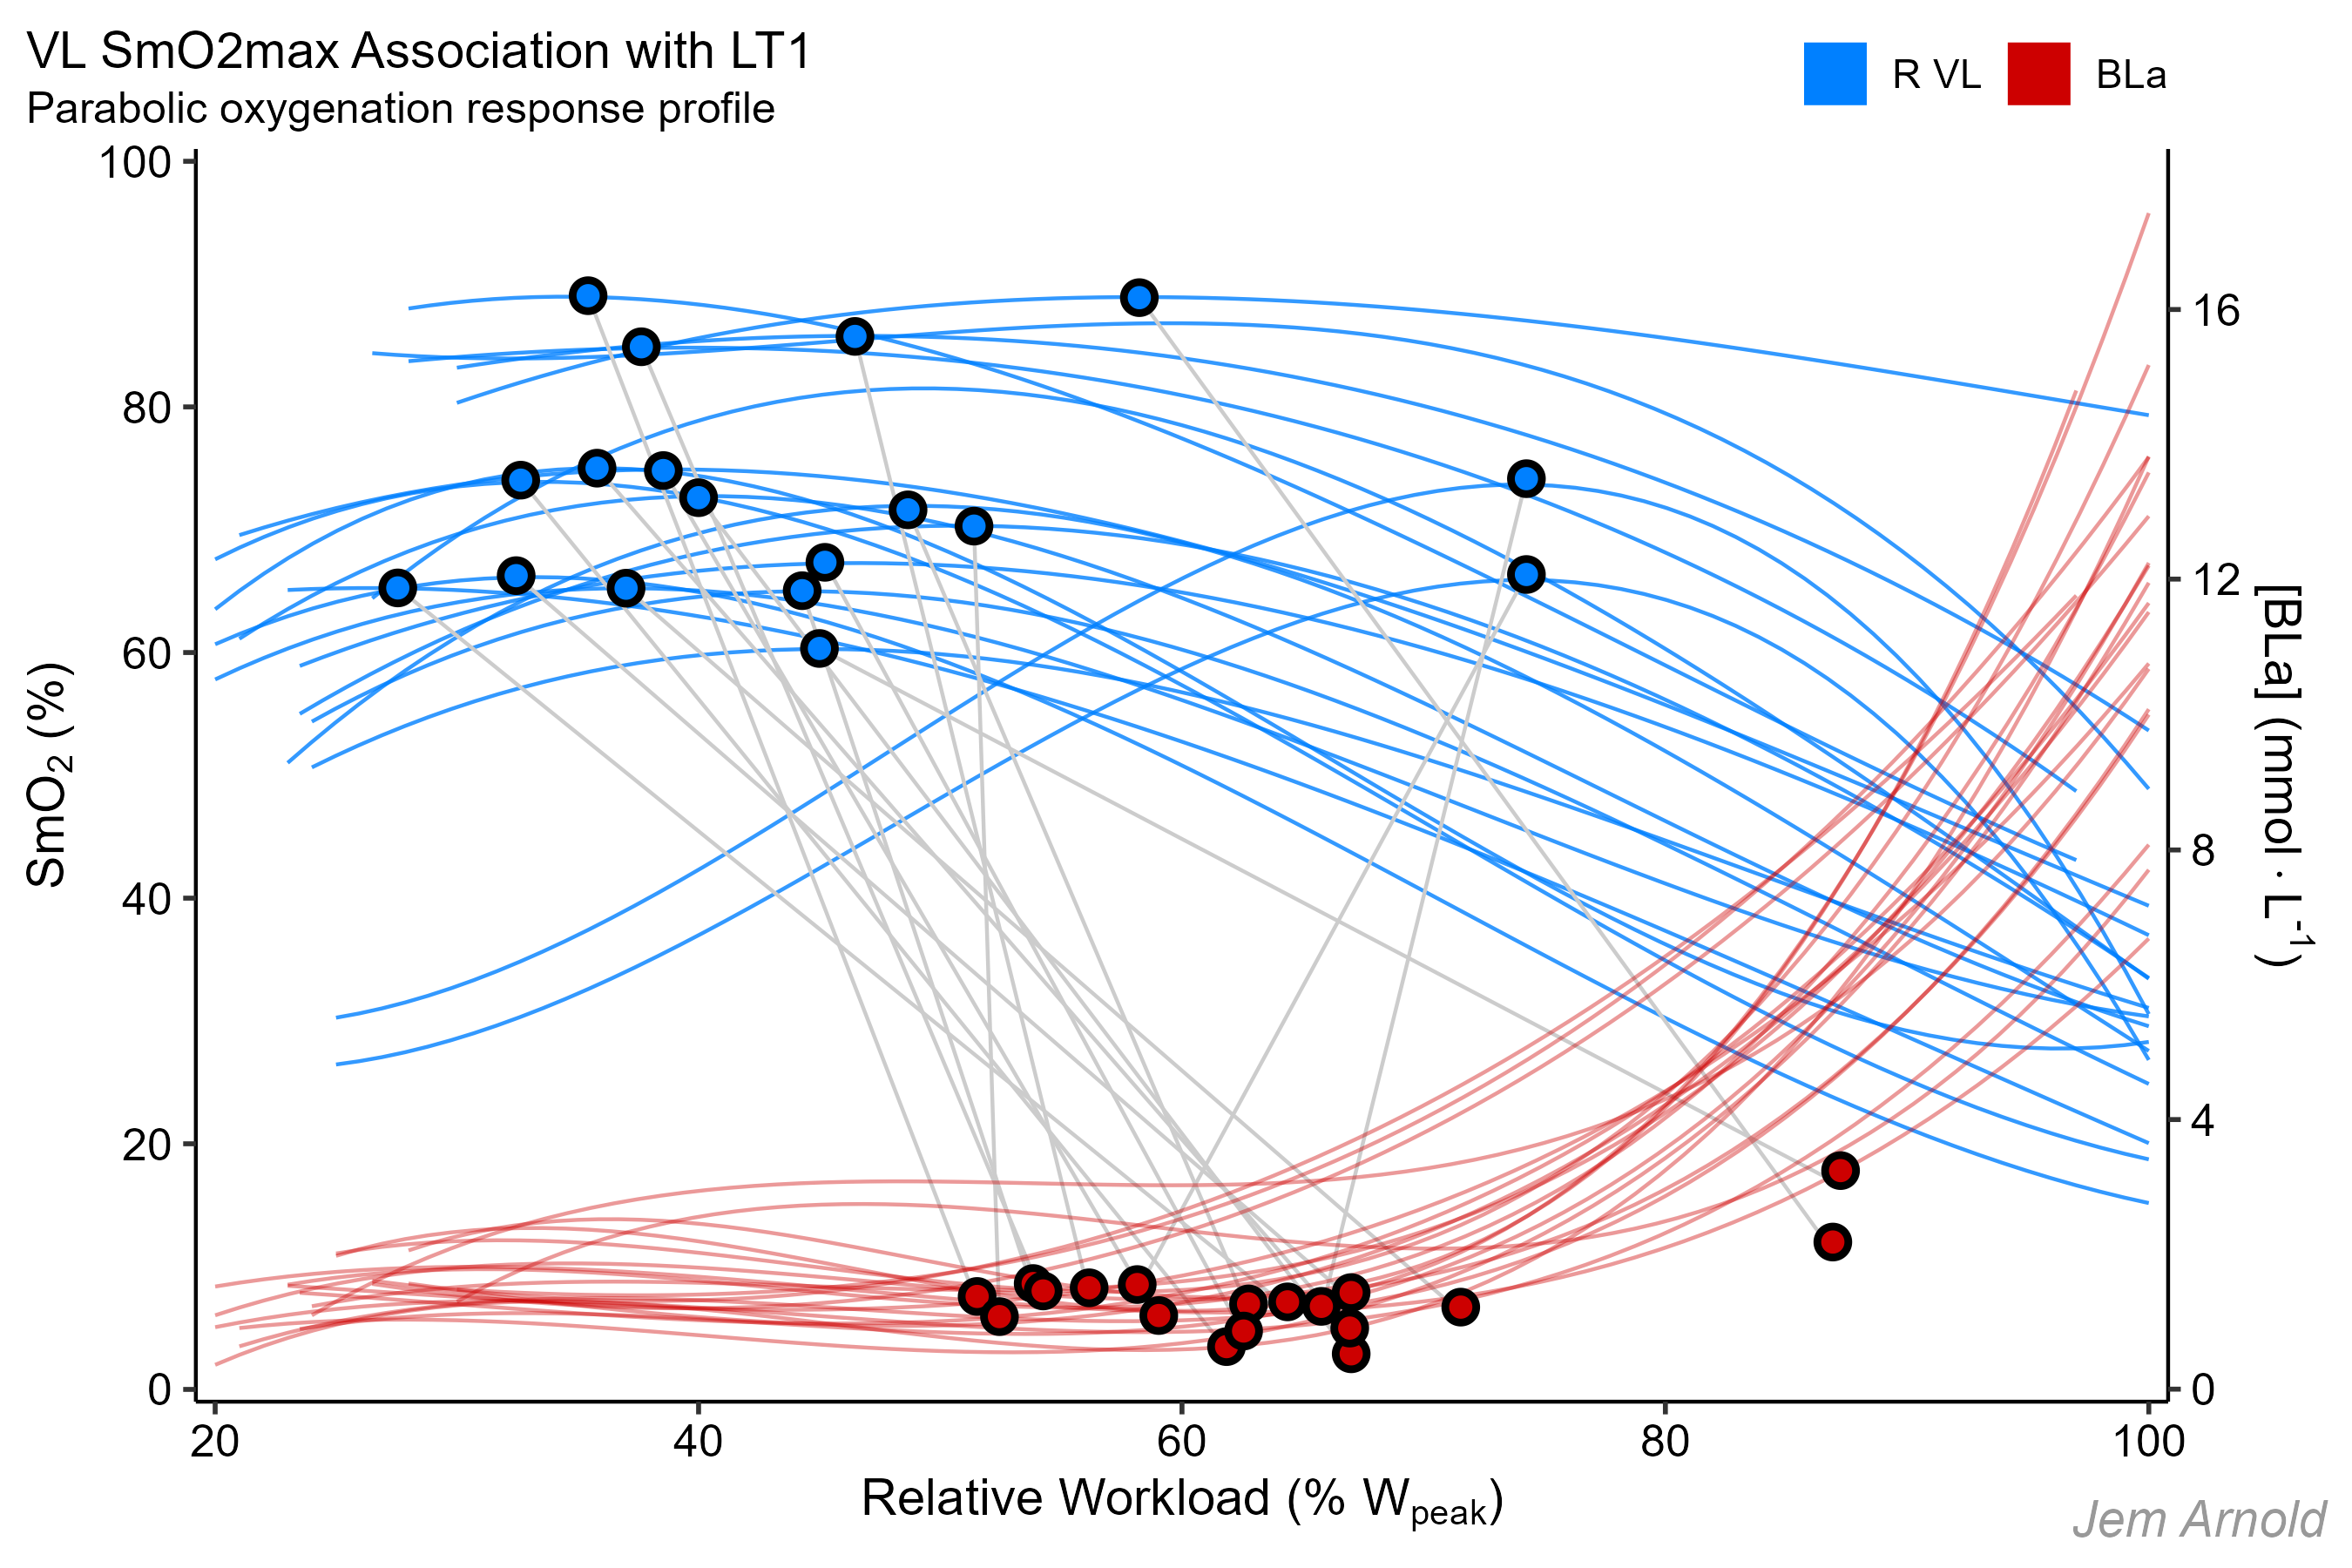
Relative workload (%) on the x-axis
BLa (mmol/L) on the right-side y-axis
SmO2 (%) on the left-side y-axis
Grey lines connect SmO2max & LT1 values within the same subject. We can see that SmO2max tends to be below below LT1, with some individual variation.
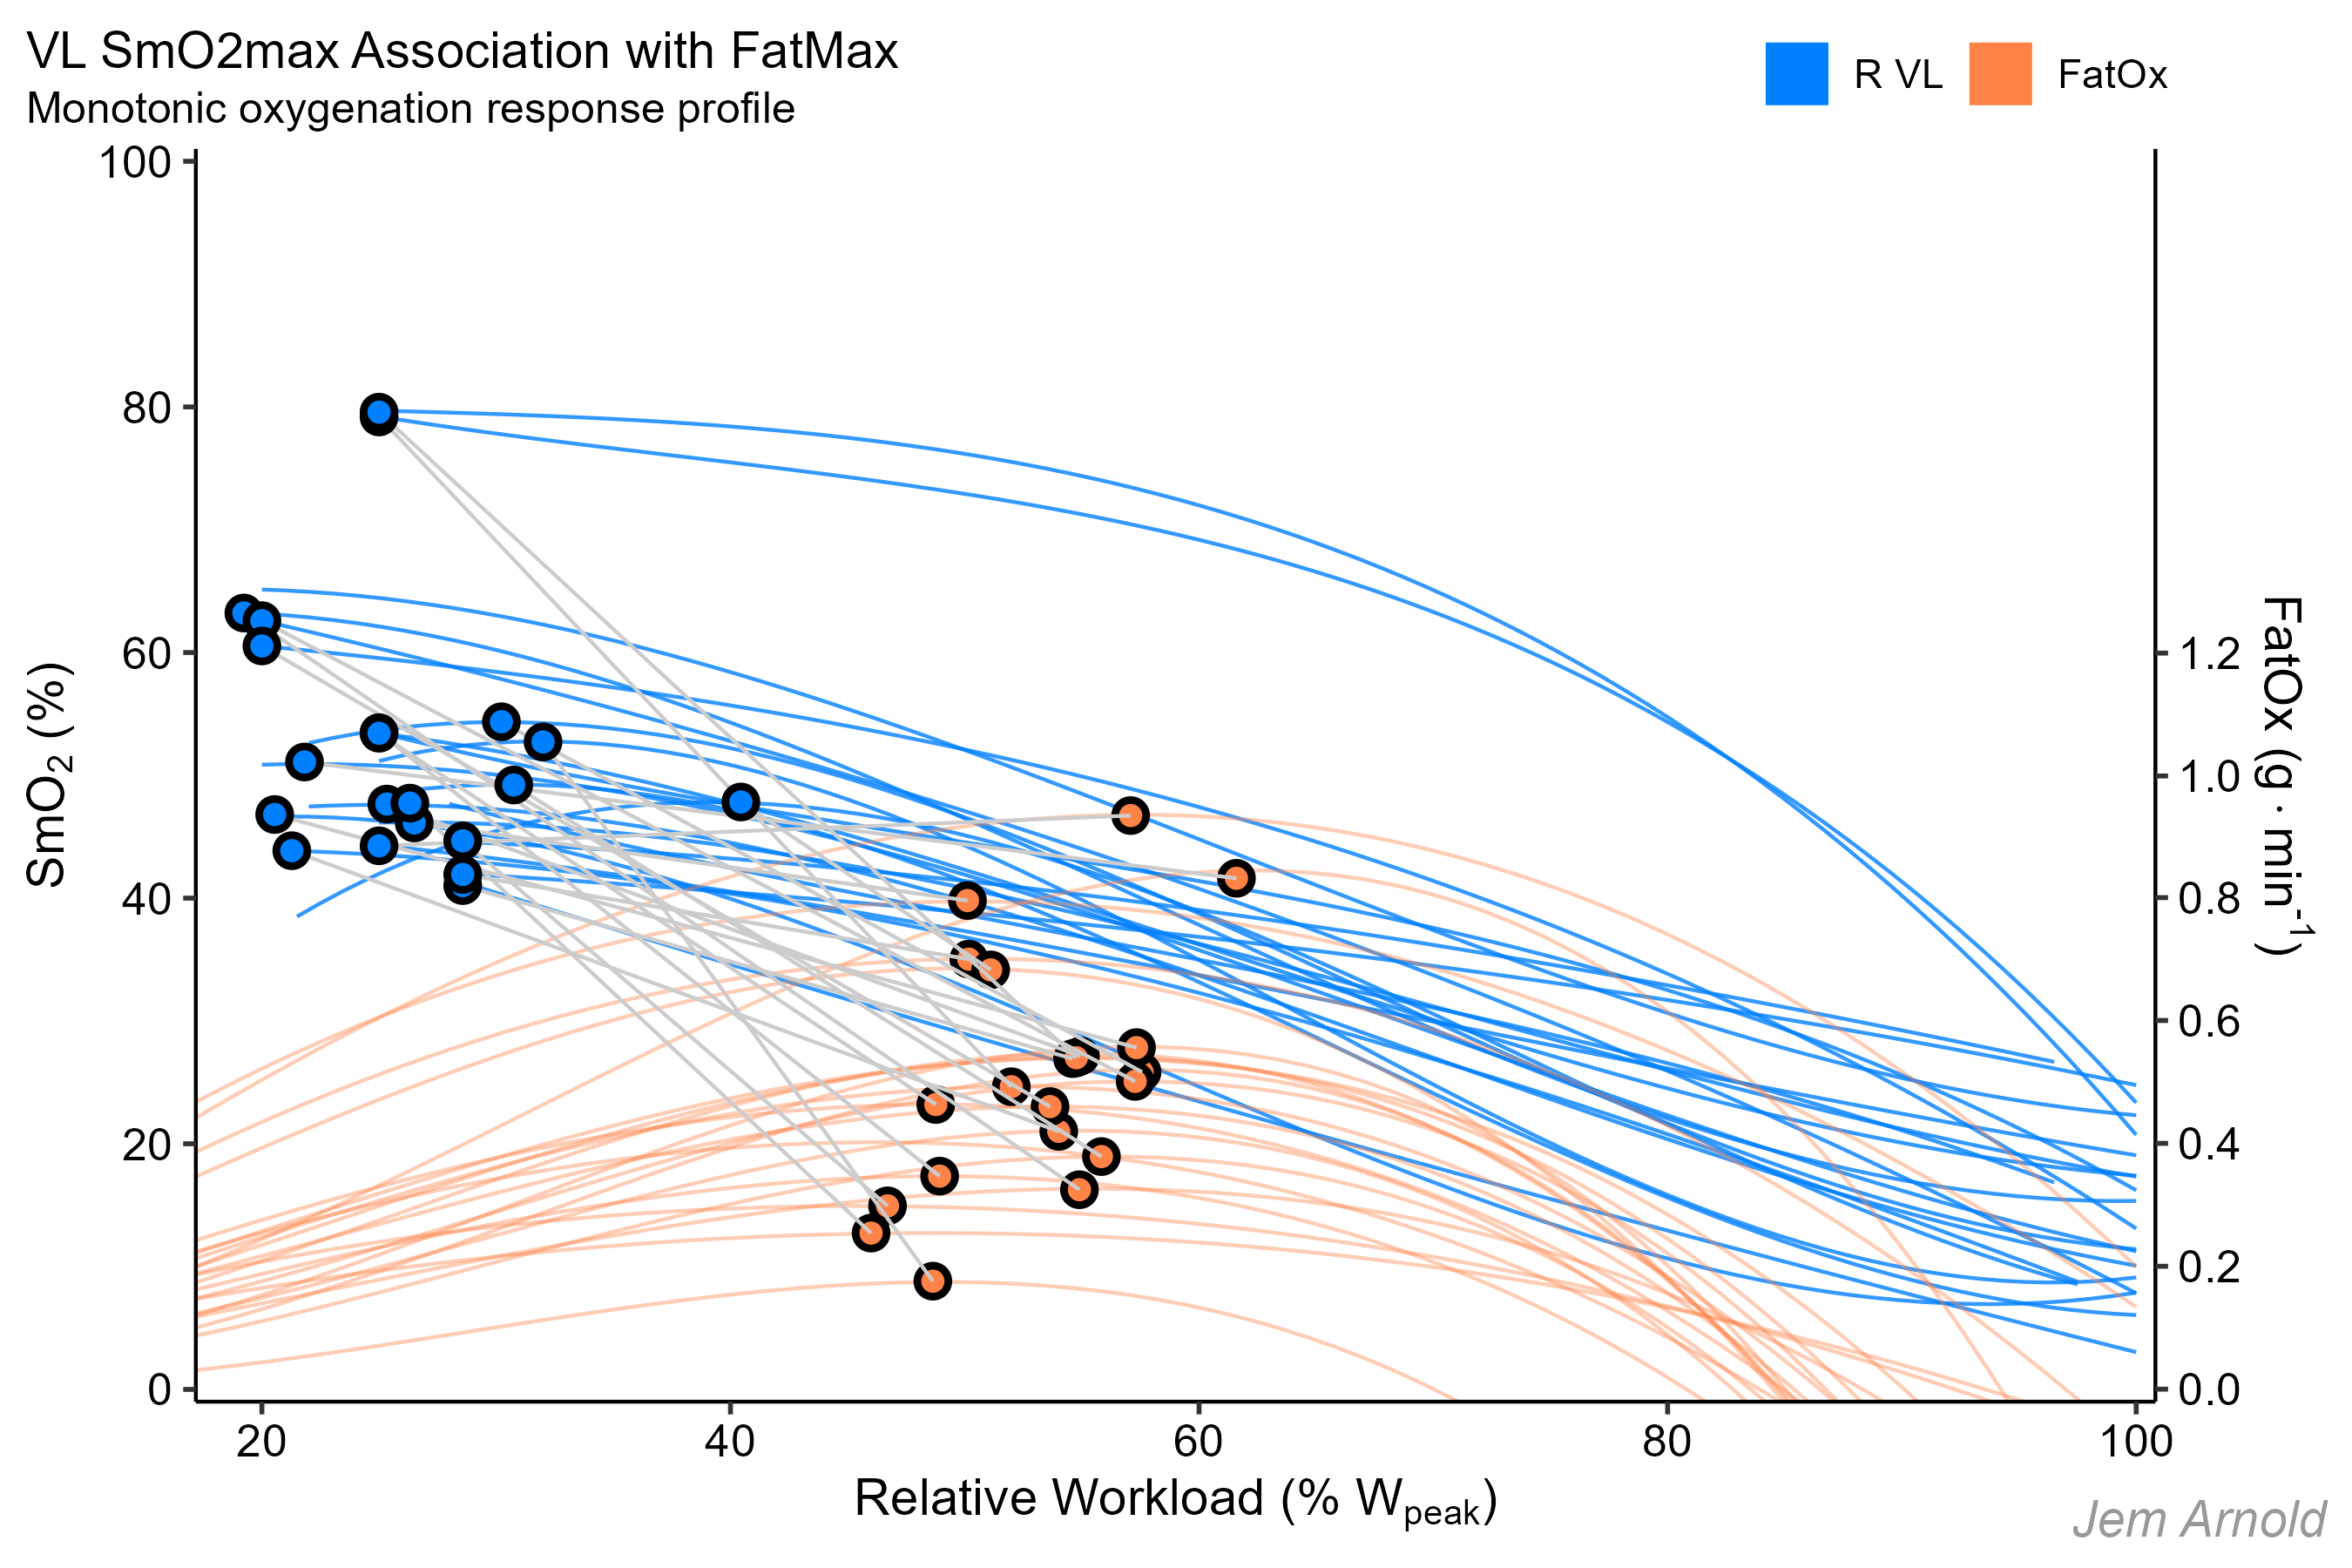
Relative workload (%) on the x-axis
Fat oxidation (g/min) on the right-side y-axis
SmO2 (%) on the left-side y-axis
Grey lines connect SmO2max & FatMax values within the same subject. Again considering individual variation, SmO2max might be a reasonable proxy for FatMax.
So a simple exercise guideline for these athletes might be to train at an intensity that allows SmO2 to remain around their maximum. Which should mean the balance of mQ̇O2 is high relative to mV̇O2, where blood flow, oxygen delivery, nutrient and substrate flow are all high.
However, for a monotonic athlete this advice is inappropriate. The clue is in the name I’ve been using: monotonic means SmO2 always decreases as workload increases. So the workload that allows SmO2 to remain near it’s maximum trends toward zero.
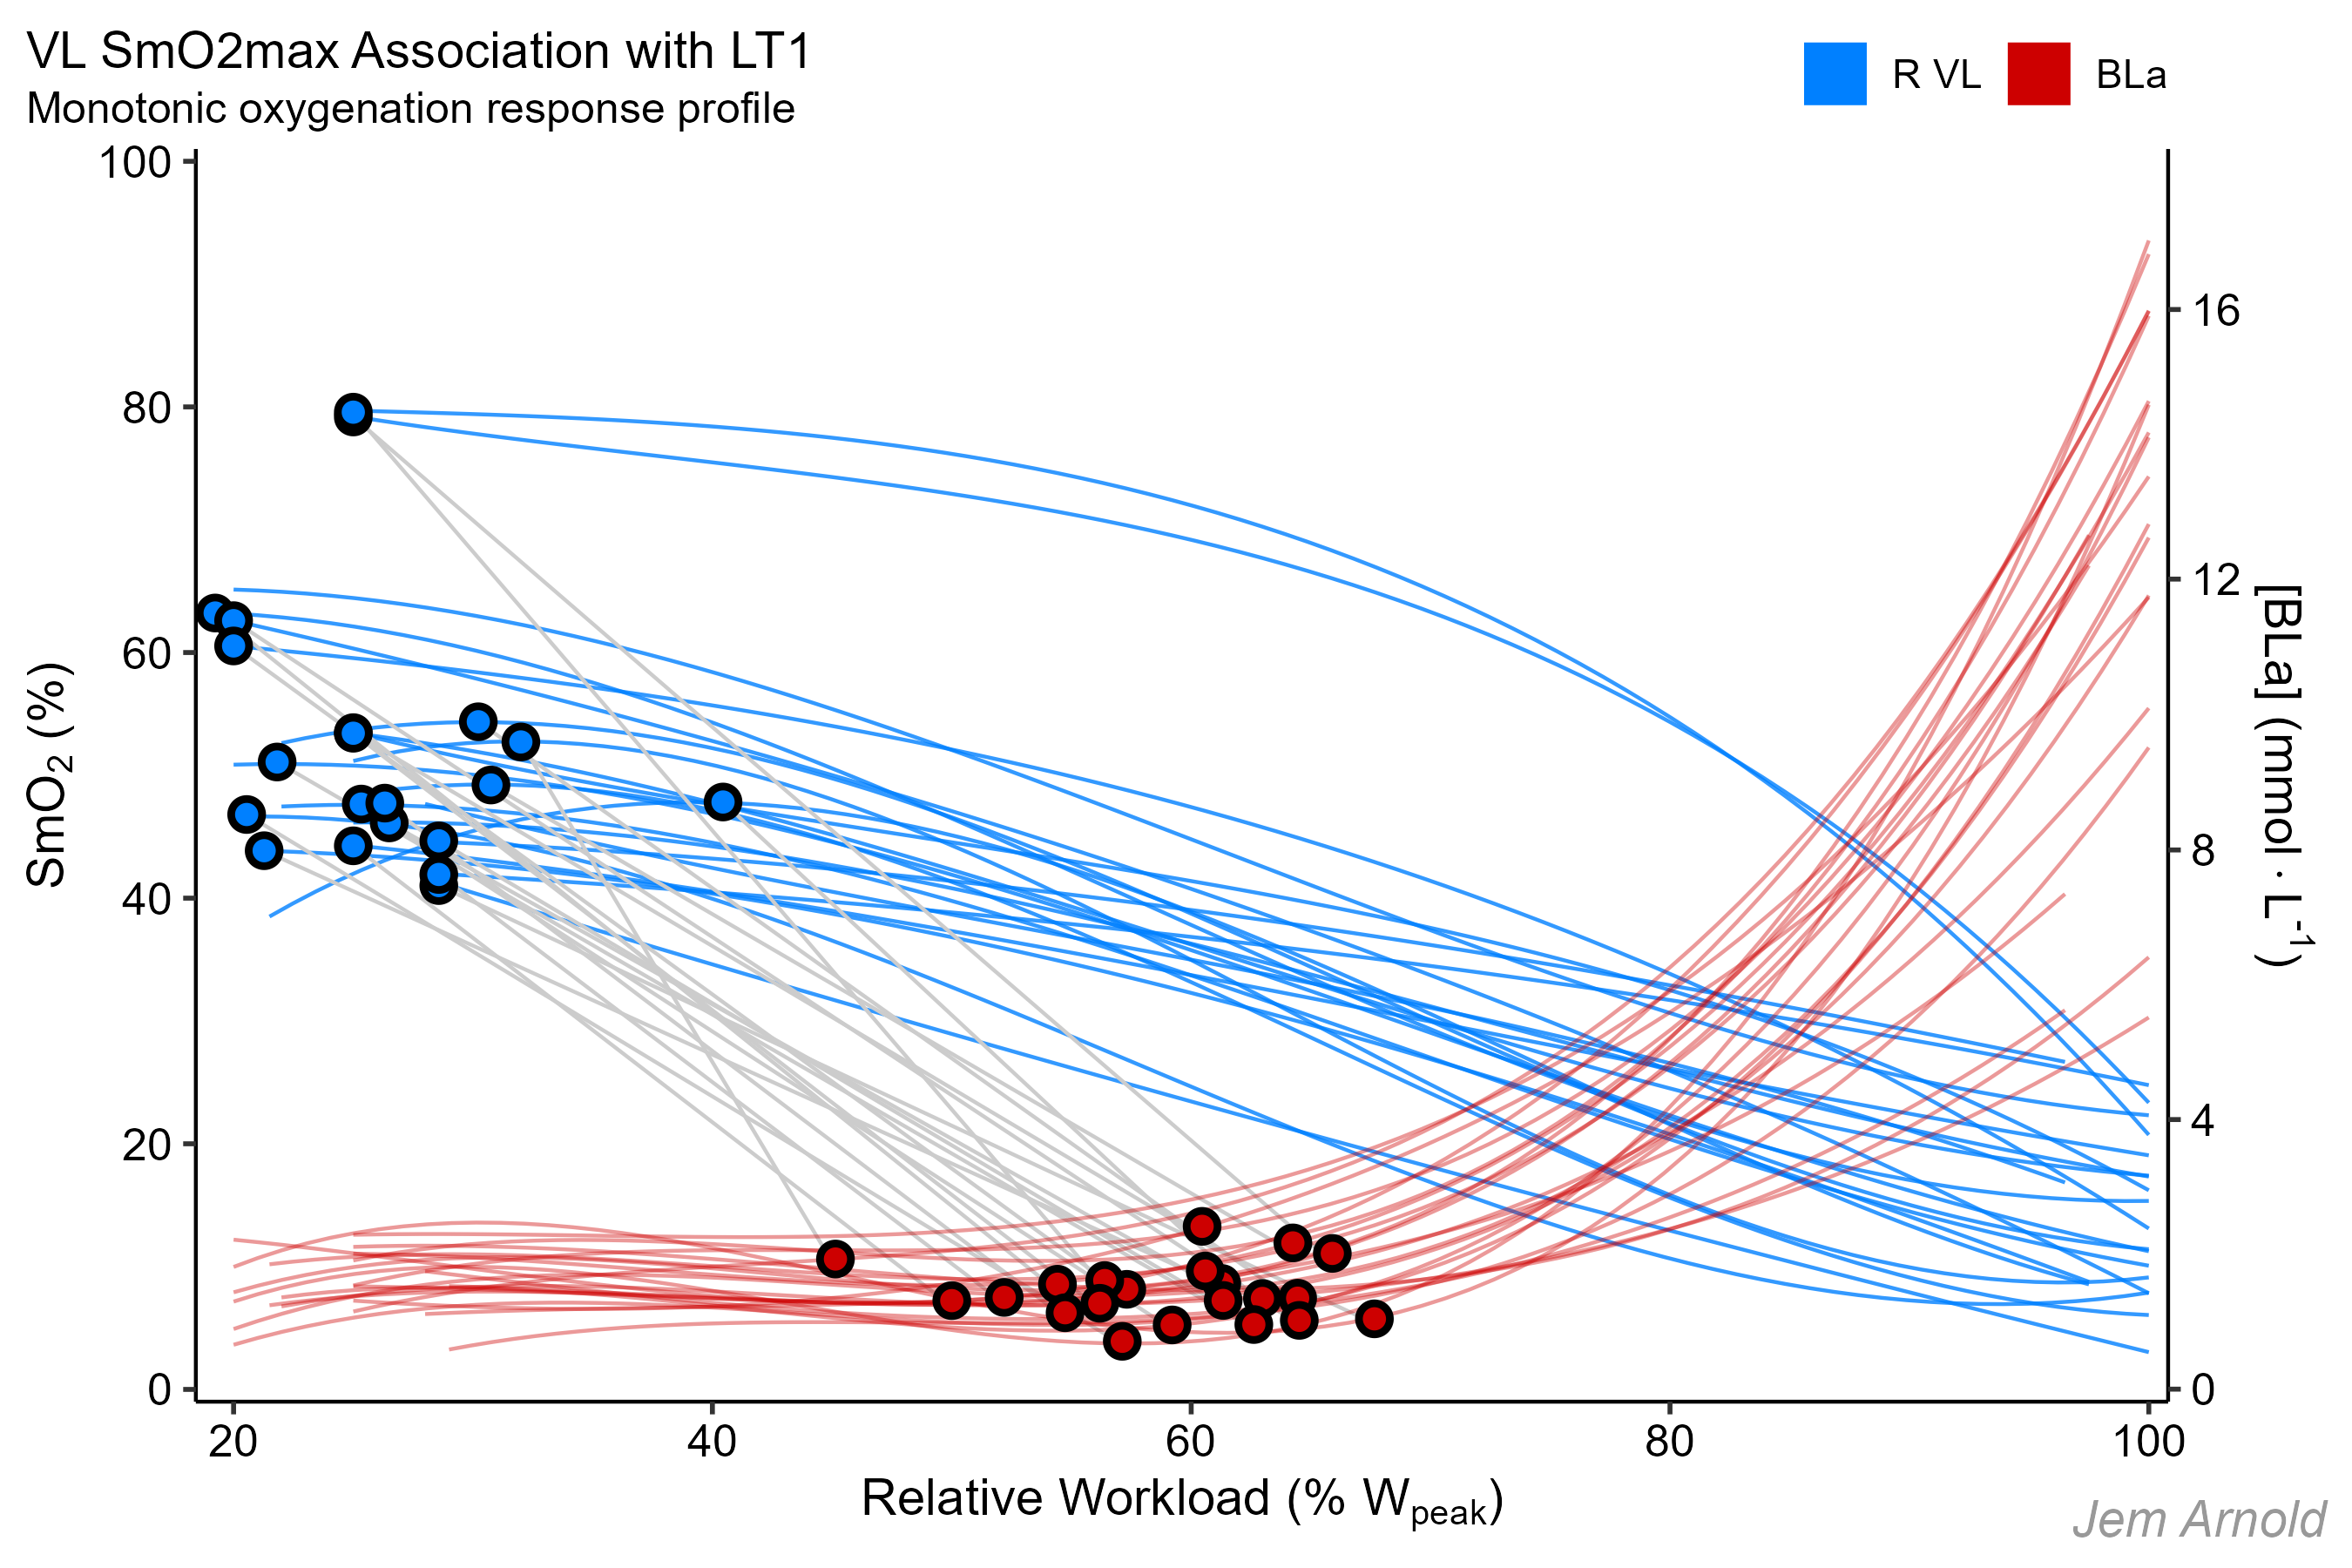
SmO2max for most athletes is basically attained during the first workload. But I guess at least you could guarantee that SmO2max is below FatMax / LT1, meaning the athlete would be performing in the moderate intensity domain as intended.
I joked with Mikael that giving this training advice to these athletes, they would end up walking… which might not be bad advice for more glycolytic-predominant athletes!
For these athletes, low-intensity training prescription has to be a bit more nuanced, observing SmO2 profiles not just as a function of intensity, but of duration as well. And any NIRS response should be triangulated with power, heart rate, and sensations/interoception.
This goes for any interpretation of physiological data, in my opinion.
Recent literature suggests that NIRS-derived deoxygenation-breakpoints (deoxy-BP) are only loosely associated with other physiological threshold demarcations, such as lactate and ventilatory thresholds, or performance thresholds including critical power.
In our own research, we found that deoxy-BP was associated with the respiratory compensation point (RCP, or VT2) at a group level, but that at an individual level this association broke down. There was no consistent sequence of how the local muscle and systemic pulmonary breakpoint appeared, and there were large variability between these markers.
When compared as power output, the variability was anywhere within ± ~100 W
I discussed this further in a recent blog post talking about sources of physiological variability and measurement uncertainty in sport science research & coaching application.
Most of the prior literature considers VL muscle oxygenation during a ramp incremental test, rather than the multi-stage protocol we use, and where we have mostly observed these oxygenation profiles.
However, considering that SmO2 deflects in different directions between these two oxygenation profiles (i.e. accelerating deoxygenation at higher intensity in parabolic profile, vs plateau of deoxygenation at minimum in monotonic profiles) maybe we should be sub-grouping these athletes to more appropriately describe and compare the deoxy-BP to associated physiological thresholds.
Another example of how oxygenation response profiles can be interpreted to inform training prescription is to consider high intensity interval training (HIIT) in the severe (SVR) intensity domain.
Monotonic profile athletes tend to reach near their physiological zero SmO2 at intensities only slightly above critical power (CP; ≈ FTP, etc). This is apparent in the gentle plateau of many individual response profiles at higher workloads in the monotonic group, shown above.
Some research suggests that this phenomena represents a local maximum in O2 uptake (i.e. a ceiling in local O2 diffusion capacity; mDO2). Once again this is speculative, but maybe this suggests that we can program HIIT at a workload that just about elicits this ‘near-zero’ SmO2 in monotonic athletes, which will likely not be much higher than CP, and therefore could be modulated in favour of longer work bout durations to optimise performance adaptations.
Longer work bout duration has been shown to be associated with improved time trial performance, while work bout intensity showed no association.
The author of this meta-analysis, Dr. Michael Rosenblat also spoke with Mikael on That Triathlon Show a couple years ago discussing this and his other meta-analyses on interval training programming. Very worth a listen.
Parabolic profile athletes, on the other hand, characteristically only reach their physiological ‘zero’ SmO2 at maximal task tolerance. i.e. SmO2 deoxygenates at some rate (slope) proportional to the workload above CP.
One thing this suggests is that time to exhaustion (TTE) may be predictable if the athlete’s SmO2 minimum is known, and the deoxygenation rate can be controlled, as long as that rate remains linear (which it may not).
So for parabolic athletes, HIIT intensity and duration may be modulated by observing and controlling the rate of SmO2 deoxygenation in real-time. This was also proposed by Brett Kirby et al at the Nike Sport Research Lab, as ‘critical oxygenation’ in runners, as part of the work behind the Nike Breaking2 project.
Each of these application strategies will only work for the appropriate athlete, and so knowing their oxygenation response profile may allow for more individualised training prescription.
Conclusion
So why should we care about oxygenation response profiles?
Because they probably reveal some insight into local muscle architecture and athlete phenotype.
Because they probably allow for better individualisation of training prescription.
Because they may be a way to empirically explain a greater portion of variance in NIRS measurement between individuals.
But mostly because they hint at some interesting and so-far unexplained, but apparently systematic physiological variance. And unexplained variation means we still have things to learn about human physiological response to exercise.
NIRS expands the spotlight under which we can observe physiology in vivo and in situ during exercise. We are still learning (or at least, I am still learning) about what a lot of our observations mean.

Amazing post Jem. Congrats
LikeLiked by 1 person
Maybe two profiles in same athlete but different sports? Like Parabolic in cycling and monotonic on rower , maybe because more muscle massa involved
LikeLike
Very possible! This came up in a twitter conversation recently
https://mobile.twitter.com/EliasLehtonen/status/1578010536180154369
Something I didn’t discuss in the article is how non-locomotor muscles show more parabolic profiles. Which suggests that maybe ‘parabolic’ SmO2 profile is driven by lower metabolic priority tissue. So then we would probably expect different recruitment patterns in other exercise modalities, or different metabolic priorities with more or less involved muscle mass, to present more parabolic or monotonic profiles.
Andri Feldmann just published a study looking at runners & cyclists and discussed these profiles, but I believe only observed them in cycling
https://pubmed.ncbi.nlm.nih.gov/36157967/
What do you think? What might lower body & upper body muscle sites look like in rowing?
LikeLike