I’ve had a lot of trouble recently trying to nail down some of the ideas grinding around in my brain. As demonstrated by the growing clutter of abandoned topics in my Drafts folder over the past few months.
So I thought an easier place to start would be first laying out some questions and smaller ideas, instead of trying to perfect a grand unified theory of exercise physiology, and end up not writing anything at all..
Muscle Oxygenation vs Heart Rate for Internal Training Load Monitoring
A recent small, but compelling finding in our research with Moxy muscle oxygenation was looking at the reliability & repeatability of muscle oxygen saturation (SmO2) compared to HR for a typical high intensity interval workout.
We had a group of well-trained male subjects (VO2max > 60 ml/kg/min) perform a series of 4x4min high intensity workouts with multiple Moxy sensors. One of the ways we looked at the SmO2 data was to calculate a ‘deoxygenation area’ for each interval. Where the difference between peak SmO2 and measured SmO2 during each interval were summed to arrive at a total deoxygenation area for the workout. This ends up looking like an ‘area above the curve’, as illustrated below.
This calculation is somewhat analogous to measuring external work in joules (J or kJ) for a workout, where the power is summed during each interval to calculate the total workload (W*sec = J).
The process using SmO2 gives us something like a measure of total internal workload at the muscle under investigation (arb units: SmO2*sec). We compared this metric to time above 90% HRmax as a measurement of total internal training load.
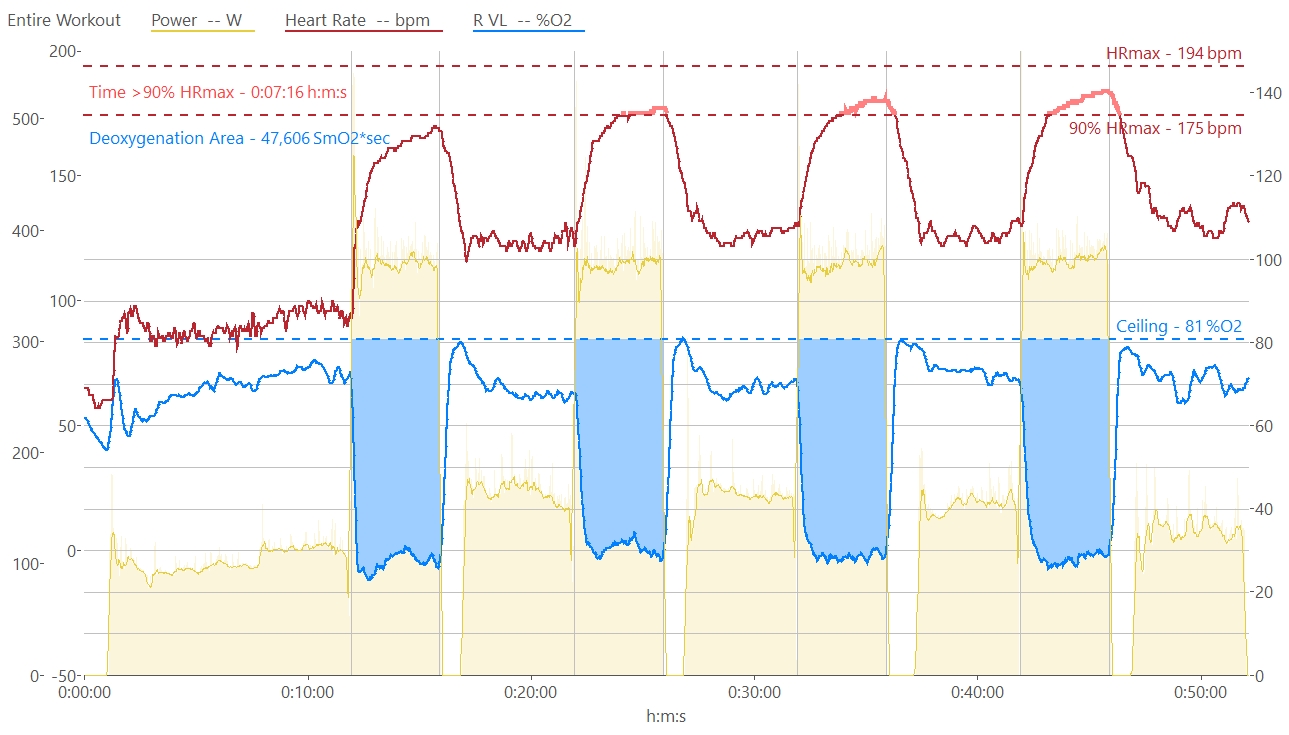
‘Deoxygenation area’ (blue) and time >90% HRmax (red) calculated for a representative workout, calculated in WKO5
We aren’t saying these are interchangeable measurements, nor are we making any claims about what this ‘deoxygenation area’ represents mechanistically. The promising finding is that the relationship between internal and external workload appears to be more reliable for deoxygenation area than for time >90% HRmax. I’ll show the stats below, but the concepts are worth considering first.
The chart above illustrates how the deoxygenation area (blue) is more consistently proportional to power (yellow), whereas HR shows a typical drift through the workout. Time >90% HRmax likely underestimates both the internal and external training load of this workout.
I’ve argued in the past that time >90% HRmax is a decent, but far from perfect proxy for time >90% VO2max. However my opinion has gradually been drifting away from accepting this relationship as a useful comparison.
In this case we did not measure VO2, but the workouts were prescribed at 110% of power at each athlete’s second ventilatory threshold (VT2 or RCP). This intensity should be similar to a typical 4x4min ‘VO2max’ workout.
As a brief aside into my current thinking, HR is simply too variable to be a reliable metric for internal training load. Both the strength and weakness of HR is that as a systemic internal measurement it is sensitive to many internal and external factors.
Power is exclusively a measurement of external work and doesn’t tell us how the body is producing that power. There are many helpful models that can estimate internal intensity from external workload (a distinction for another time), but I’ve written previously about some issues I have with over-extrapolating metabolic information from power.
I still believe RPE – relative perceived exertion – is a better metric for simple tracking of internal workload. Hard workouts should be hard, and easy workouts should be easy. Your brain knows how to take care of the details.
Everyone loves looking at images of numbers, so let’s look at some Excel charts full of numbers! I’ll try to be brief going over the relevant stats, but I think the take-home is straightforward enough here.
The interesting numbers to look at here are the coefficients of variation (CV). This tells us how much each measurement varies between workouts, as a percent of
the mean value (top row).
This is a single representative subject. ie, the subject with the best numbers
to show the trend we’re seeing 🙂The massive difference between the variability of Time >90% HRmax (22%) and the deoxygenation area factors for both the right and left VL (6-7%) suggest that whatever this NIRS-derived metric is telling us, it’s more closely related to external workload across workouts (4%) for this subject.
These are the same stats run on the full group (9 subjects). Again I think the most relevant comparison here is how closely the variability of the deoxygenation factors follows that of the external workload, compared to time >90% HRmax.
Remember, this is a moderately heterogenous group so we would expect some variability in work (15%) based on differences in individual power targets. The variability of the oxygenation factors (16-23%) is no greater than what might be expected between individuals, whereas time >90% HRmax (46%) has nearly 3x the variability!
Disclaimer: Stats are not my strong suit. I barely know what I’m talking about here, which is why I wanted to show the data themselves. Feel free to call me out if I’ve interpreted these data inappropriately.


EDIT: A good question posted below got me to look at how power, RPE, HR, and oxygenation area were related. More detail below, but briefly:
- The subjects reported almost universally that the field trial was lower RPE than the lab trials, despite power actually being a few percent higher on average.
- Time above 90% HRmax tended to be lower in the field, although not significantly different than in the lab (the variability was high overall, as above).
- Oxygenation area at the VL tended to be slightly higher in the lab, meaning the work-oxygenation factor, which reflects the power output per unit of deoxygenation, was significantly higher (more “efficient?”) in the field. Where power was slightly higher and RPE was lower!
Further Implications of a Work:Oxygenation Factor
This is another promising application for using Moxy and other portable NIRS sensors for tracking internal training load. I’ve encountered some other papers looking at similar ‘area under the curve’ calculations for NIRS measurements, sometimes with mixed results. And similar findings for reliability of NIRS over HR. Such as in trail running where NIRS measurements were found to give a better indication of running intensity than HR across varied terrain (Born et al, 2017). I would imagine this finding would translate well to cycling races where intensity is even more highly variable.
This work-oxygenation factor gives us a potential tool for comparing how much external work has been performed for a given level of local deoxygenation. Importantly this can be calculated at various workloads and over various durations, starting to build a more detailed power-duration-oxygenation profile for an individual athlete.
The final units of this measurement can be derived independent of time as W/SmO2 (or W/HHb for different NIRS devices) and may reveal a proxy of local metabolic efficiency. In plain language the work-oxygenation factor describes “how many watts are produced per unit of oxygen de-saturated from a set baseline, at the target muscle under investigation.”
I think this metric will be most useful in tracking changes within an individual athlete over time, rather than comparing efficiency between individuals. Looking at how this value may change over time with training might reveal something more about how physiology has responded to that training.

This is actually completely different NIRS data, just to illustrate what tracking work-oxygenation factor might look like. And to raise the question of what these data might suggest if they were real, about how the athlete has adapted to training over the previous months.
For example, a greater work-deoxygenation factor would be found in the case of either higher power output for the same level of deoxygenation, or less deoxygenation for the same power output. Higher isn’t necessarily better, so what could this change be telling us?
Both situations might indicate a greater relative O2 delivery capacity to the working muscle (and if this statement sounds like it’s coming out of nowhere, wait for a forthcoming article going into a bit more detail on what information can be interpreted from NIRS). The former case suggests that the muscle was able to raise O2 extraction to match the increase in delivery, resulting in greater power output.
The latter case might suggest that while O2 delivery has improved, the local muscle has not – was not able to, or has not needed to – increase extraction to match delivery, resulting in power remaining the same. This could indicate that the athlete might be extraction-limited at the local tissue, or that the net power output is coming from somewhere else.
This has implications for assessing physiological limiters to performance and what training prescription this athlete might respond better to.
Questions to Ponder
What kinds of training could a coach prescribe an athlete if she suspected muscle oxygen extraction was relatively more limited than oxygen delivery?
What about oxidative capacity of other muscle groups contributing to power output? Not all watts come from vastus lateralis. How can we integrate muscle oxygenation measurements from multiple sites to gain better information on metabolic recruitment patterns and contribution to power output?
That’s a topic that raises many questions. Which I will hopefully write about soon(ish).

Jem – Great to see the evolution of your thinking, but frustrating as well! I appreciated the >90% HR concept for deriving VO2 work. While I might do a running interval workout with 14:40 at VO2 pace, my heart rate data can suggest actually working the VO2 system for 11:15; which I might discount a little further since some of that VO2 HR is during the recoveries. Most important is the conclusion of ~10+ minutes within zone. I apply the same “objective” math to my VO2 bike workouts as well.
I am not quite sure how to apply your current thinking to the analysis of workouts. While RPE has consistently been proven a (surprisingly) reliable metric, it is still too squishy for post-workout review.
Is it now more accurate to apply a certain percent (~85%) of “Time In Output Zone”?
Is it now more accurate to take >90% HR as the minimum amount of time in VO2?
In lieu of OR in addition to hard starts, maybe “throw out” the first interval before applying time in zone?
LikeLike
Thanks jdb.
RPE is indeed a squishy metric, and you won’t be analysing anything on the order of how many seconds you spent at 9/10 vs 8/10, etc. But I don’t think your body cares about a handful of seconds here or there either. The value of RPE is a simple, subjective metric for assessing how hard you are going right now, or your effort on that last interval, or your workout earlier this week. The whole ’80/20′ concept was (to my understanding) based on intended session intensity, ie. session RPE. Not on precise durations spent in zone as is often misunderstood.
I think you will still find value in HR for post-exercise analysis. Time in zone – power or HR – is still a legitimate way to quantify training load . If you know what 90% HRmax means for you, or what ‘Zone 4’ means for you, that will be a valuable benchmark for performance changes over time. Similar to my thoughts on deriving VO2 from power, I just think it’s unnecessary to over-interpret HR data to reflect VO2 in any but the broadest, most hand-wavy terms. “My HR was high, so my VO2 was probably high”.
I would suggest caution trying to apply general rules and targets to your own individual physiological response. Find the target that works for you. Maybe that’s 90% HRmax, maybe 85%. Maybe it’s a combination of ragged breathing, a certain sensation in your legs, and when your left rib starts to cramp, you know you can’t hold this pace much longer!
Then plug the workout into WKO or Golden Cheetah and see how all the cool time in zone data and post-hoc analyses compare to previous efforts!
LikeLiked by 1 person
I guess I should mention, to the point of this article, that muscle oxygenation metrics like the ‘work-oxygenation factor’ I’ve introduced here, might be able to solve that equation between external and internal workload/training load. Eventually… Still working on it 🙂
LikeLike
I’m very) pleased to see you post. I have a Humon Hex and while it interesting I think it could be more useful.
The especial thing I am interested in is using it to track longitudinal change between workouts rather than just what happens during a workout.
So if you have any advice or documents about this please point me in their direction.
(FWIW I’m a long term power based trainer for near 15 years now and my passion, like I suspect yours, is how to use science to become a better rider. So far its worked remarkably well, despite passing 60 last year I set all time personal bests including raising mFTP to 5W/kg
LikeLike
Hi Martin,
5 W/kg at 60+ is super impressive! Must be a lifetime of hard work 💪
At the end of the article I speculated a bit and posed some questions about longitudinal tracking, but I don’t have the answers yet. We need to better understand how muscle oxygenation changes with acute and chronic changes to fitness. And even how it correlates to adaptive signalling within a single workout.
For the example I’ve given here of ‘oxygenation area’, I might be able to accumulate the same area from a 4x4min VO2max workout as, say a 2hr low intensity aerobic ride. The adaptive signalling from those two workouts are very different, so will muscle oxygenation be able to detect that?
My only advice – and I’m following this advice as well – is just to keep using NIRS ourselves and keep building a picture of what it means for us, individually. You probably already have a good sense of what spending time in Humon’s ‘red zone’ means for you in terms of workout intensity, or quality. We will come up with better questions to ask, and better experiments to run to get better answers!
LikeLike
Thanks for the reply. I’m recording most rides with my Hex so eventually hope to see some patterns emerge
LikeLike
Hi Jem,
Loved the post and ended up with so many questions. Did you notice if your perceived effort matched more closely with HR or de-oxygenation? Do you have any thoughts on what types of adaptations are more closely tied to the heart rate and which adaptations are tied to deoxygenation? What about local vs systemwide? Are some adaptations done by the whole body when there is lower global oxygenation?
Thanks again for the article.
LikeLiked by 1 person
Thanks J.P. Good questions. Long answers.
On RPE. When I did these workouts (the data pictured are not from me, but I wrote about my pilot test data in my previous article), one of my lab trials felt way harder and I had to drop the power to complete it. My time >90% HRmax during that trial was 4:30 compared to 13:19 in the next lab trial when I felt relatively better (these are still at least 8/10 RPE workouts). Muscle oxygenation was only slightly different between these two trials. So in my case higher RPE was related to lower HR, while ‘oxygenation area’ was more closely related to power output. My ‘work-oxygenation factor’ was essentially the same between the two workouts despite the difference in subjective sensations.
Here’s the interesting part:
– The subjects reported almost universally that the field trial was lower RPE than the lab trials, despite power actually being a few percent higher on average.
– Time above 90% HRmax tended to be lower in the field, although not significantly different.
– Oxygenation area at the VL tended to be slightly higher in the lab, meaning the work-oxygenation factor, which may reflect something like metabolic efficiency or contribution of the target muscle (VL) was significantly higher (more “efficient”) in the field, where RPE was lower and power was slightly higher!
I’ll be writing more about what these metrics look like at different muscles that we have looked at.
On adaptations. I’ve been learning more about the different adaptations elicited by sprint interval training (SIT; think 30sec sprint, 4min rests) vs high intensity interval training (HIIT; more like these 4x4min workouts), which have some very interesting implications. HIIT tends to cause more central changes to cardiovascular system on the O2 delivery side, possibly related to longer duration spent at higher blood pressure and greater cardiac output (HR * stroke volume). SIT may elicit more peripheral change at the muscles, ie. to O2 extraction. So the two measurements I’m comparing here may each be more related to their own ‘domain’, than to each other, as you suggest.
I genuinely don’t know to what extent ‘global’ deoxygenation occurs throughout the body during exercise, but yes in general adaptive signalling is correlated to local deoxygenation. I don’t have a good grasp on what the precise parameters are: eg. duration below a certain critical level of deoxygenation (tissue hypoxia), the absolute extent of deoxygenation, where that hypoxia is occurring within the muscle structures or across the whole body. I’m just starting to learn more about adaptive signalling pathways to answer some of those questions on how deoxygenation is related, and whether we can make any claims about ‘adaptive efficacy’ from measuring oxygenation alone.. but it’s waaay too early to say anything about that!
LikeLiked by 1 person