I’ve been drawing up more comparisons of my historical L/R asymmetry, now that I know the source of the issue. Here’s a quick comparison of previous ramp tests from the last three seasons, done around the same time of year.
January 2016
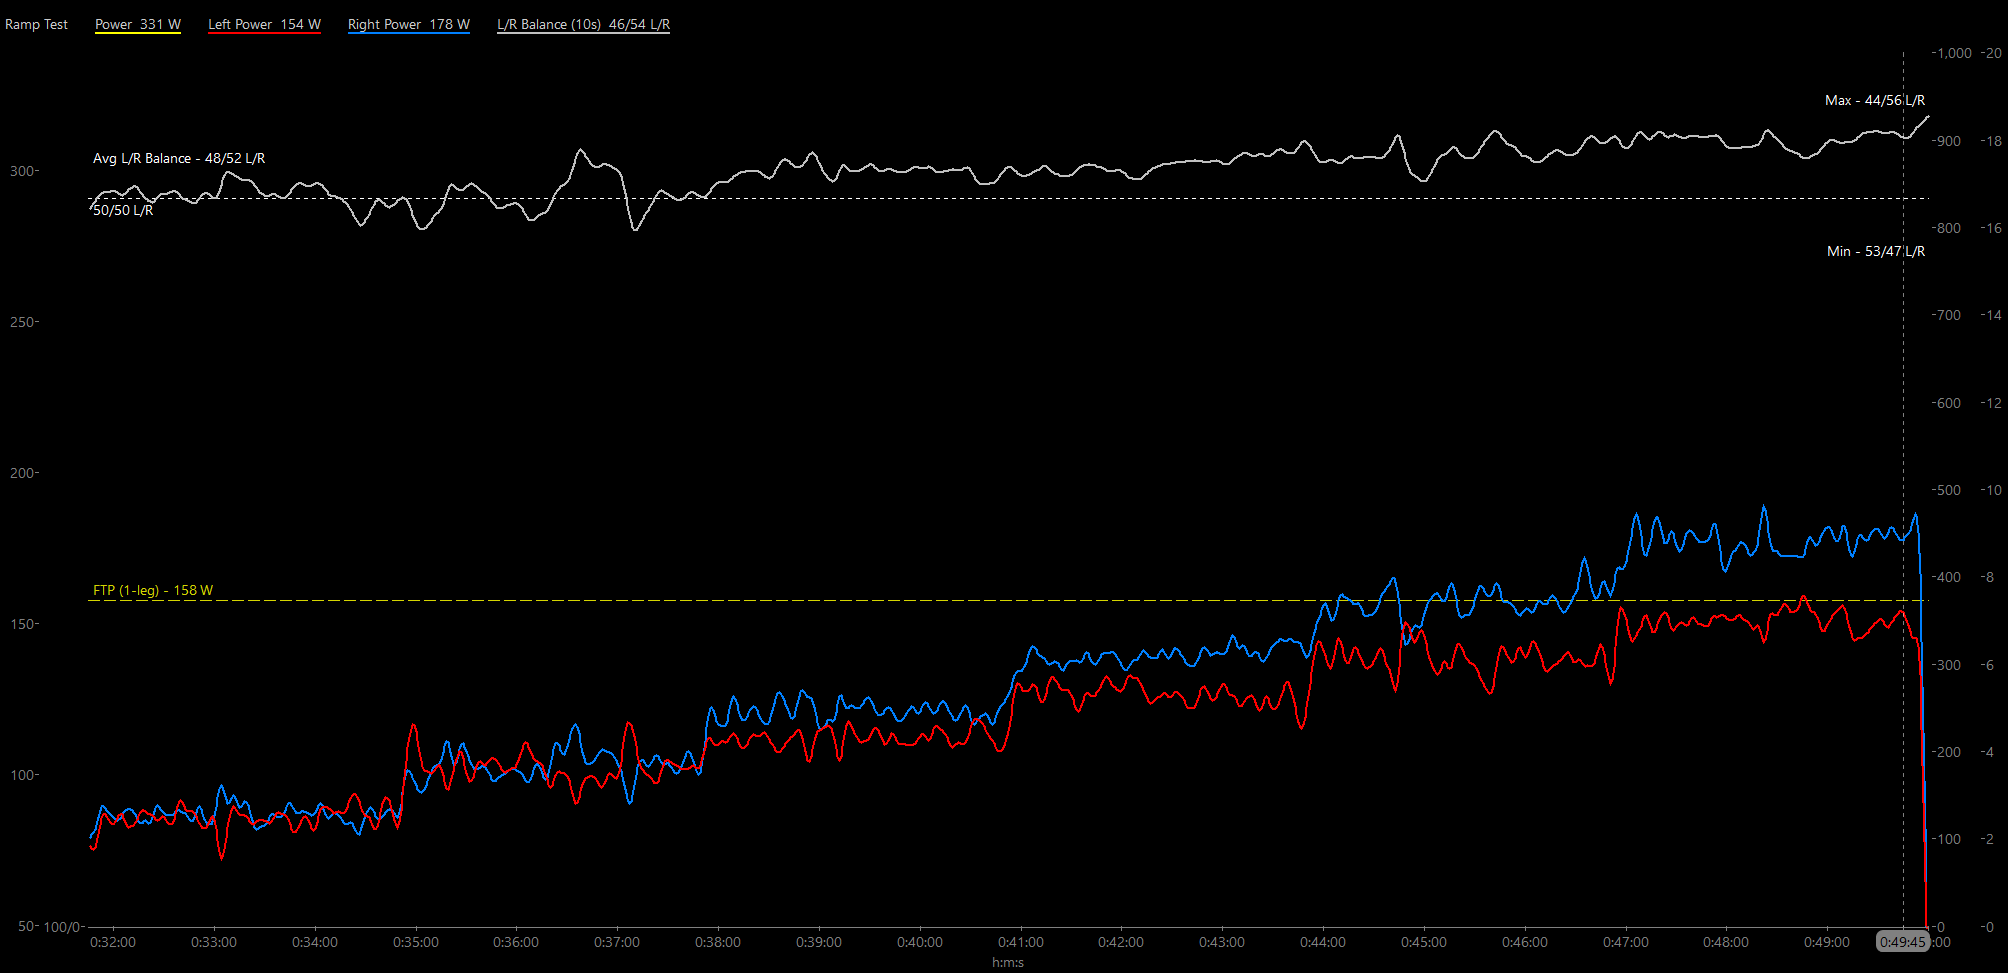
- Red is Left leg power
- Blue is Right leg power (each measured independently)
- Yellow dotted line is my FTP at the time divided by 2 (310 W / 2 = 155 W) to give a reference for 1-leg threshold
- White is L/R power balance, smoothed to easily visualize and compared to 50/50 dotted line. Avg, min, & max are also given

L/R balance begins at around 45/55. I would call this a significant asymmetry right off the bat. As power exceeds threshold (310 W, around Stage 6) L/R balance begins to diverge even further. Slowly, but surely, up to a ~75 W net difference during the final completed stage!
I haven’t verified this, but I’ve heard (and it makes sense) that athletes might have non-pathological L/R imbalances at low intensities, when the whole system isn’t called upon to work at full capacity. But that imbalance should improve at higher intensities, as the body has to recruit everything to reach the target workload.
An imbalance such as mine that worsens at higher intensities, may be more indicative of a pathological asymmetry worth investigating further.
January 2017
- Red – L leg power
- Blue – R leg power
- Yellow – 1-leg threshold (FTP/2)
- White – L/R balance

Slightly longer test and smaller power jumps each stage (less visible step-ups), but same general asymmetry as prior year. L/R balance begins around 45/55 until just above threshold (320 W, Stage 10) then diverges further.
Interesting to note, L leg power (red) never exceeds much above 1-leg threshold in these ramp tests. This may or may not be relevant. I looked back into all the ramp tests I’ve done with L/R power, and only one test (the one in Feb 2017 immediately below) doesn’t follow this trend. So possibly more than coincidence, but I’m not yet sure what this means… other than my L-leg seems to limit my threshold, which I already knew.
February, 2017
- Red – L leg power
- Blue – R leg power
- Yellow – 1-leg threshold (FTP/2)
- White – L/R balance

I must have spent all of January last year working on L leg base fitness, because by Feb 2017 I had brought my L leg Aerobic power up to roughly 50/50, until power approached aerobic threshold (AeT, also approximately LT1/VT1).
This was a lactate threshold lab test. The test estimated my AeT to be ~285 W, mid-Stage 4. I was skeptical that this felt way too high to me, but interesting to note that mid-Stage 4 is exactly where my L/R Balance began to diverge from 50/50.
Anaerobic threshold (basically FTP, or AnT, or LT2/VT2… acronym soup) was estimated at 330 W, between Stages 5-6. Again this felt too high to me at the time. I was certainly getting a bit ragged on the bike, as demonstrated by the less consistent power during the later stages.
One more very interesting thing to note. My power during the final stage (at the cursor) is nearly 40 W higher in Feb 2017 than it was in Jan 2017. However the majority of that improvement (30 W) comes just from my left leg! So does this reflect a systemic training effect, or just an improvement of the limiting factor: blood flow (therefore Oxygen supply) to my left leg?
January 2018
- Red – L leg power
- Blue – R leg power
- Yellow – 1-leg threshold (FTP/2)
- White – L/R balance
- This test was NOT maximal, so not a perfect comparison to previous
Again Aerobic power was maintained around 50/50 until around 230 W, which is a lot less than ~285 W where the power balance diverged the year previous, but plausibly close to aerobic threshold (AeT) at the time.
However this ramp test was designed to be submaximal, only bringing me to Anaerobic threshold (FTP/LT2/VT2). So I can’t compare whether L/R balance would have diverged further at higher intensities, but I strongly suspect so.
Conclusions
Earlier in my cycling career my L/R balance was significantly worse overall, up to a 40/60 L/R power difference at higher intensities! I was able to improve L/R balance, especially at lower intensities, I believe through focusing on aerobic training in 2017 Base phase.
I’ve even been able to reach ~50/50 symmetry at very easy intensities, but as soon as physiological demand begin to rise, the blood flow restriction becomes the limiting factor, my left leg begins to drag.
Training during Base phase of 2017 seems to have significantly improved L leg power, but not R leg power. I’m not sure what this suggests in terms of peripheral L leg limitation vs central/systemic training adaptations.
Some fun new questions to explore! I’m curious to investigate further looking at how my left leg sustains power above threshold (FTP / 2) during ramp tests and steady continuous efforts, eg. 20-min test. Also whether I can correlate the divergence away from 50/50 in recent seasons to an improvement in Aerobic Threshold. Some very interesting implications if these findings hold true!

Which power meter do you use to measure you L/R balance?
LikeLike
I currently use 4iiii Precision Pro Dual-sided power meter. I had a Pioneer Dual-sided PM for the first couple seasons.
LikeLiked by 1 person
I remember videos (from GPLama) where some the current dual sided power meters had some serious issues with showing the correct dual-sided power. There‘s even one video where he recalibrates his Vector 3 with static known weights and has to use an individual calibration factor for each pedal.
LikeLiked by 1 person
Oh interesting. Yeah, I definitely considered that and tried to prove the theory that my PM was showing a false asymmetry, but it always held consistent. Across multiple bikes, brands of PM, and multiple models of my current 4iiii.
I ‘calibrate’ my PM(s) to my Kickr to at least get a baseline for net power.. which I know has it’s own margin of error, but at least it’s another source of consistent comparison. I’m pretty satisfied that the asymmetry is in my legs… obviously. I can certainly feel it!
LikeLiked by 1 person
Oofftopic: Stumbled across your blog, (IIRC while I was searching something about Intervals). I like what and how you write about your training stuff – good mix of personal experience and science). The screenshots with manual annotations are very neat – makes it easy to understand in a glance.
Subscribed. ✅
LikeLiked by 1 person
Thanks mate! Appreciate it. Yeah I really like the insight that WKO4 custom charts allow. I’m constantly trying to come up with new ways to find and visualize trends, and spamming my athletes with some new cool chart that I’ve found 😀
LikeLiked by 1 person
😂🍻
LikeLike