Recently I was asked to compare how closely WKO-modeled VO2 (VO2mod) tracks against actual measured VO2. My last few articles looked at how measured pulmonary VO2 (pVO2) tracked with HR for both continuous and intermittent workouts. So let’s look again at a few VO2max intervals and see how well the modeled numbers track to measured VO2.
pVO2 is measured with the VO2 Master Pro wearable VO2 analyser.
Modeled VO2 in WKO is estimated based on real-time power and the athlete’s 90-day historical power-duration curve. The data below are visualized in WKO4 with some heavily customized charts. I’ll discuss the charts in much more detail over the coming weeks.
WKO5 was actually just released this week, and I’m already seeing some massive improvements in functionality. But I’m also seeing some bugs on my machine at least. I may have to wait to completely transfer over. I might be posting a mix of WKO charts for posts in the near future.
Hard-start VO2max Intervals
The first workout we’ll look at is the same 3x6min hard-start decreasing-power interval from back in December, 2018 that we looked at previously. Briefly, these are intervals designed to rapidly bring the athlete up to near VO2max with a high power start, then decrease power as the athlete fatigues to extend the duration sustained above 90% VO2max.
3x6min Hard-start VO2max Intervals
Measured VO2 from VO2 Master Pro and Modeled VO2 from WKO4
- Power in yellow
- Heart Rate in red, highlighted above 90% HRmax
- Modeled VO2 in Dark Blue (VO2mod in L/min) in the foreground, highlighted above 90% Modeled VO2max
- Measured VO2 in Light Blue (pVO2 in mL/min) in the background, highlighted above 90% Measured VO2max
- Time >90% HRmax and >90% VO2max reported at top right, along with R2 which shows how closely the two VO2 lines are correlated

First thing worth pointing out is the difference between measured & modeled VO2max. WKO-modeled VO2max is estimated from the athlete’s 90-day historical power-duration curve. This workout was performed early in base training, so I expect my PD curve was not completely filled in. This would have resulted in a lower VO2max-mod estimate than what I was actually capable of in reality. This explains why the 90% VO2max targets occurred at different magnitudes for pVO2 (5000 mL/min) and VO2mod (4270 mL/min).
Looking at absolute VO2 through the workout, we see good agreement between the VO2 lines during the warm-up and recovery intervals. This suggests that the model was accurately able to predict VO2mod at submaximal intensities. The lines are also very close during the initial rise in VO2 at the start of each work interval.
Importantly, the times accumulated >90% VO2max (reported at top right) also show good agreement and track well to time >90% HRmax. Despite the different magnitudes for VO2max, both pVO2 and VO2mod reported me above 90% VO2max for around the same duration.
The difference comes during the decreasing-power work intervals. VO2mod is derived from power (which I’ll talk about more in an upcoming post) so as power decreased through the interval, VO2mod therefore also declined. However in reality pVO2 remained elevated during these intervals, as you would expect for a continuous near-maximal effort.
Without going into detail again, this difference may have been exaggerated by my Left leg blood flow limitation. This condition significantly degrades the power I can sustain for high intensity efforts. So let’s take a look at a similar workout from another athlete.
Steady-power VO2max Intervals
This workout was done in May, 2019. It was performed outside on Cypress mountain on the North Shore of Vancouver. This is kind of amazing that we can collect VO2 data in real-time on the road, literally in a real-world environment.
These weren’t targeted to be specific VO2max intervals. They were steady-power 5min intervals at a specific target power above the athlete’s FTP. Based on the athlete’s subjective report that he “was worried about puking in my mask by the end” I think we can assume he approached VO2max during the workout! 😅
3x5min Steady VO2max Intervals
Note, since we didn’t establish true VO2max with a ramp test, I will be using the athlete’s VO2peak, the highest 30-second VO2 value he achieved during the workout, instead of VO2max.
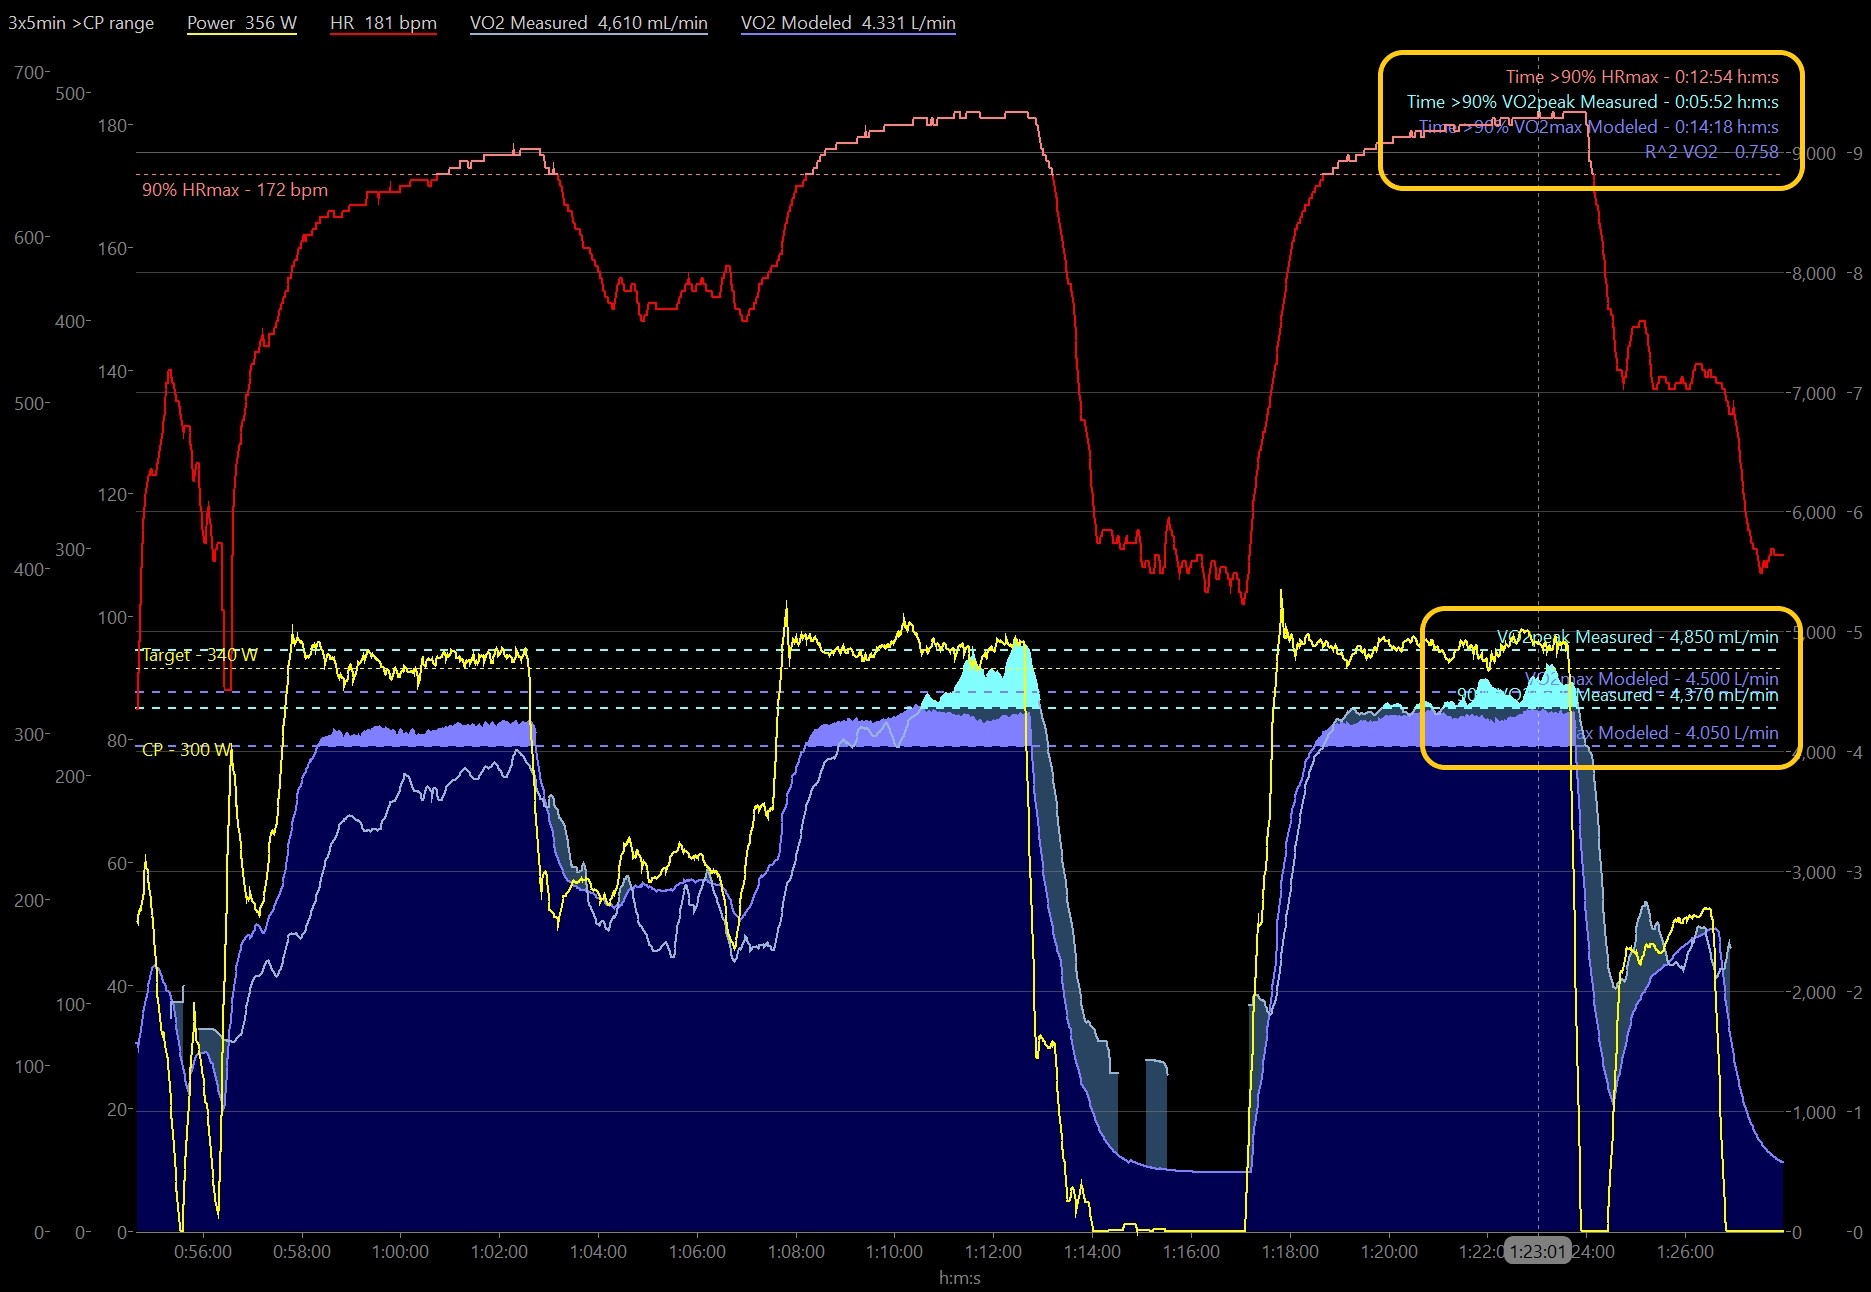
This athlete showed a much closer estimate for pVO2peak (4850 mL/min) and VO2max-mod (4500 mL/min). This likely indicates that his PD Curve was more filled in and better reflected his true fitness.
We can again see that the major difference between measured & modeled VO2 was during the work intervals. While the decreasing-power intervals above show a steady-pVO2 trend, the steady-power intervals here show pVO2 increasing through the interval, as expected. This is caused by the VO2 slow component, which is basically a manifestation of fatigue and loss of efficiency during high intensity efforts above Critical Power or FTP.
VO2mod derived from power isn’t designed to account for fatigue or the VO2 slow component during a constant work rate interval. As a consequence the model ends up over-estimating VO2 during the first interval, and under-estimating VO2 during the third interval.
There is also a difference in VO2 onset kinetics during the first two intervals. VO2 onset kinetics refers to the speed at which systemic aerobic metabolism ramp-ups in response to a change in workload (demand). Especially during the first interval, pVO2 was slower to rise than predicted by VO2mod. Very interestingly, pVO2 kinetics sped up through the workout, to be nearly identical to the predicted model by the third interval.
Looking Closer at VO2 Onset Kinetics
More recently I experimented with VO2 onset kinetics by going straight into a 5min VO2max interval without any prior warm-up.
One of the major reasons we perform a warm-up is to stimulate our aerobic system to work faster (ie. improved VO2 kinetics) and more efficiently. This ensures our body is primed to respond quickly to any change in workload (demand) with a rapid delivery of oxygen (supply) to the working muscles.
VO2 onset kinetics are markedly faster after a prior hard effort (ie. a priming effect, also see Bailey et al, 2008). So I decided to observe for myself how VO2 would react to an initial ‘cold’ effort, compared to subsequent ‘warm’ efforts.
3x5min No Warm-up Intervals

The first ‘cold’ interval shows the expected slower kinetics in pVO2 and a lower peak pVO2 compared to subsequent intervals. VO2mod remains the same across all three intervals. Once again VO2mod is derived directly from power. The rise in VO2mod will be proportional to the rise in power, regardless of the internal and external factors (fatigue, fueling, temperature, etc.) that influence VO2 onset kinetics in reality.
Even considering the difference in magnitude of measured & modeled VO2max as previously discussed, I was surprised to see the differences in accumulated times >90% VO2max. The model simply thought I wasn’t going hard enough to achieve 90% VO2max-mod at all. While pVO2 was reporting that I was well above 90% pVO2max during the two ‘warm’ intervals.
Heart rate shows an interesting comparison. Directionally it correlates better to pVO2, with a gradual increase in peak HR during each subsequent interval. However HR barely reached 90% HRmax, and therefore time >90% HRmax correlated closer to VO2mod at essentially zero… This again shows how potentially unreliable HR is in estimating pVO2.
I think the most important take-away here is the value of a warm-up for getting the highest quality out of your interval training. Also the realization that pVO2 response is not constant for repeated intervals even through a single workout session. This is a rationale for persisting through those later intervals during a workout instead of calling it quits. There still may be value to completing those final fatigued reps at a lower power target, as long as your body is still able to reach near VO2max. This is something I will collect more data on and discuss in the future.
Summary
- Modeled VO2max-mod is dependent on an accurate power-duration curve. This is no different than most of the other models in WKO derived from the PD curve. With enough relevant historical power data it seems reasonably accurate. At least from the few athletes I’ve measured.
- VO2mod derived from power during a workout appears to be fairly accurate at submaximal intensities. However as intensity exceeds FTP/CP the model is unable to account for the contribution of the VO2 Slow Component to a non-linear rise in pVO2.
- Modeling VO2mod derived from historical power might be able to describe an ‘average’ VO2 response, but it cannot capture significant day-to-day variations in internal metabolic state or external conditions. Such as VO2 Slow component, fatigue accumulation, changes in gross efficiency, VO2 onset kinetics, temperature, fueling, hydration, etc.
Conclusions
I was hoping to conclude that WKO-modeled VO2 was ‘good enough’ or at least ‘better than nothing’ for use in training analysis and prescription. Unfortunately my opinion is that modeling VO2 from power alone is too unreliable and insufficient to provide additional value. I think trying to use power to estimate a linear VO2mod relationship is a case of over-extrapolating the data that will lead to erroneous conclusions.
Power already provides us with so much meaningful and prescriptive information, but it is limited as a simple mechanical output of a chaotic internal metabolic cascade. Power alone tells us very little about internal energy production or how our bodies are working to produce that power. That’s where we need measures like HR, VO2 and SmO2.
Let me be clear, I love the debate around the value of power and heart rate. I currently come down on the side that HR, for all it’s limitations, has descriptive and prescriptive value as the only accessible measurement of internal metabolic state. Power of course has value as probably the best measurement of external mechanical work. I think it’s a clear win-win to use both together to build a more accurate picture of training effect and physiological response.
I’ll finish with an open question: could Power & HR be combined somehow to more accurately model VO2? I’ve talked before about how I don’t quite fully understand the Power-HR-VO2 relationship and how all three components interact. Could combining power & HR compensate for each other’s limitations to produce a more reliable VO2mod?
Coming up I’ll look at some intermittent intervals. Then I want to go into more detail on the WKO4 (and soon WKO5) charts I’m working with for VO2 & SmO2, and bring estimates of anaerobic power into the discussion. I’m already writing those articles so it shouldn’t be another 3 months before the next post!

Thanks for sticking with me so far!

Another great subsequent article. Thanks for all the work your putting in.
LikeLiked by 1 person
Grrrmpf, those lovely (🤥) typos… of course ‚you‘re‘, not your. 🤦🏻♂️
LikeLike
Does the VO2 Master Pro really weigh 2.2 kg? That’s what it says on their web site. If so, does that weight seem super noticeable when riding outside vs. inside?
LikeLike
Hey Steve, great question!
The unit, carrying case, accessories, and shipping box weigh 2.2kg (5lbs). The unit itself is about 300g, and is face-mounted in such a way that it does not torque the face.
LikeLiked by 1 person
Yeah Steve, what Peter said. The weight really isn’t noticeable on the face. And there’s no valve adding any pressure to inhale/exhale. The only discomfort is just from having a piece of plastic on your face when you’re breathing hard. Really not a big deal to get used to
LikeLiked by 1 person
No one cared (about decreasing power intervals) until I put on the mask.
LikeLiked by 1 person
Sorry about continuing to post replies on older blog posts. So with just power and HR available, how would you determine the effectiveness of the 6-minute hard start VO2 intervals when fatigue starts setting in? Breathing would be ragged, but that’s pretty hard to quantify.
LikeLike
Always happy to answer questions Todd! These articles are hopefully still relevant, regardless of when they were posted.
My current advice for hard-start VO2max intervals, continuous (eg. 6min) or intermittent (eg. 30/15s), is simply try to stay at 9/10 RPE at all times through the work interval. It’s like if we paced a TT horribly wrong, and we are on the edge of blowing up the whole time. Fun!
9/10 when we are fresh at the start of the interval will end up as a hard-start. While 9/10 at the end of the interval as fatigue has accumulated and we are less efficient at producing power, will naturally cause power to decrease through the work interval.
Your brain knows where VO2max is better than your HR monitor or power meter. Pay attention to those subjective sensations!
LikeLike
Thx so much!! Really helpful. I guess these are just going to suck.
LikeLike
VO2max inevitably sucks in the best possible way!
LikeLike
Hi Jem,
Any chance you’d care to share your chart on the WKO Facebook page. It looks great and would be appreciated. Kurt
LikeLike
Hi Kurt, unfortunately I don’t have access to these WKO charts any longer. The main feature of them used Garmin IQ fields with custom-added VO2 data to display alongside the modelled VO2, so you wouldn’t get much out of them anyway. Otherwise they were mostly stock charts I believe. Might still be available somewhere.
LikeLike