Sprint Interval Training – Complete Recovery Intervals
We left off with the suggestion that O2 delivery to working muscle was limiting the rate of oxygen re-synthesis (re-saturation of SmO2) in my Left leg during 90-second incomplete recovery intervals. Which was then driving the decreased net power output through the workout and producing symptomscharacteristic of blood flow limitation, and ultimately limiting performance.
After 2 hrs on the trainer at aerobic intensity, which doesn’t bother the leg but is still generally fatiguing, I decided to re-test 30sec maximal intervals. This time with 4min complete recovery intervals.
White line is L/R Power Balance highlighted where it diverges from 50/50
Red is HR, highlighted above 90% HRmax
Similar to before, L/R power balance during the 30sec work intervals were close to 50/50, however they began to diverge again during the rest intervals. But not to the same extent as the previous attempt.
The 4min recoveries were enough for L/R balance to normalize back to 50/50 before the start of the next interval. That was the first clue that the L leg was able to sufficiently recover between work intervals.
Let’s look at the combined VO2 & SmO2 chart from VO2 Master Pro & Moxy monitors and discuss the whole picture.
30sec/4min Sprint Intervals – Muscle oxygenation (Moxy) & VO2 Master Pro data
Top chart shows:
Blue line is Muscle Oxygen Saturation (SmO2 in %) for Right quadriceps
Pink line is SmO2 for Left quad
Dotted pink & blue lines show Total Hemoglobin (tHb in g/dL) for each leg respectively (we won’t focus on this yet)
Bottom chart:
Performance data as above
Blue area is Oxygen Consumption (VO2 in mL/min), highlighted above 90% VO2max
Let’s walk through the intervals and responses in SmO2 & VO2.
I started with a 2min warm-up interval at threshold (indicated by the arrow). VO2 rose nearly to 90% VO2max, which is higher than usual. As a comparison, VO2 typically only reaches ~4500 mL/min rather than 5000 mL/min during these warm-ups. In this case, greater VO2 supply for the same power output probably meant that my muscles were less efficient at utilizing O2 due to fatigue after 2000 kJ of aerobic workload, meaning my heart & lungs had to deliver more O2 to compensate.
Looking at the first work interval, L & R SmO2 show equal de-saturation down well below 5%. Again my R leg SmO2 (blue) was able to recover and re-saturate oxygen at a faster rate than my L leg (blue area shows the difference). But with the extra recovery time my L leg was able to catch up and start each work interval back at it’s baseline SmO2.
Now instead of Left SmO2 slowly declining, causing power to drop and painful claudication caused by tissue hypoxia, the Left leg was able to normalize between reps and performance was minimally affected. I felt like I was limited by genuine fatigue, rather than by the Left leg holding me back.
VO2 (blue area in the bottom chart) was also more consistent through the intervals, but never reached as high (>90%) as it did during the early workout. So in a fatigued state, the loss in efficiency presented as higher VO2 for a given submaximal power output in the 2min warm-up, but lower peak VO2 resulting in decreased maximal output during the 30sec work intervals.
Metabolic Efficiency
The final comparison I want to look at is with some derived efficiency metrics from the VO2 Master Pro respiratory data.
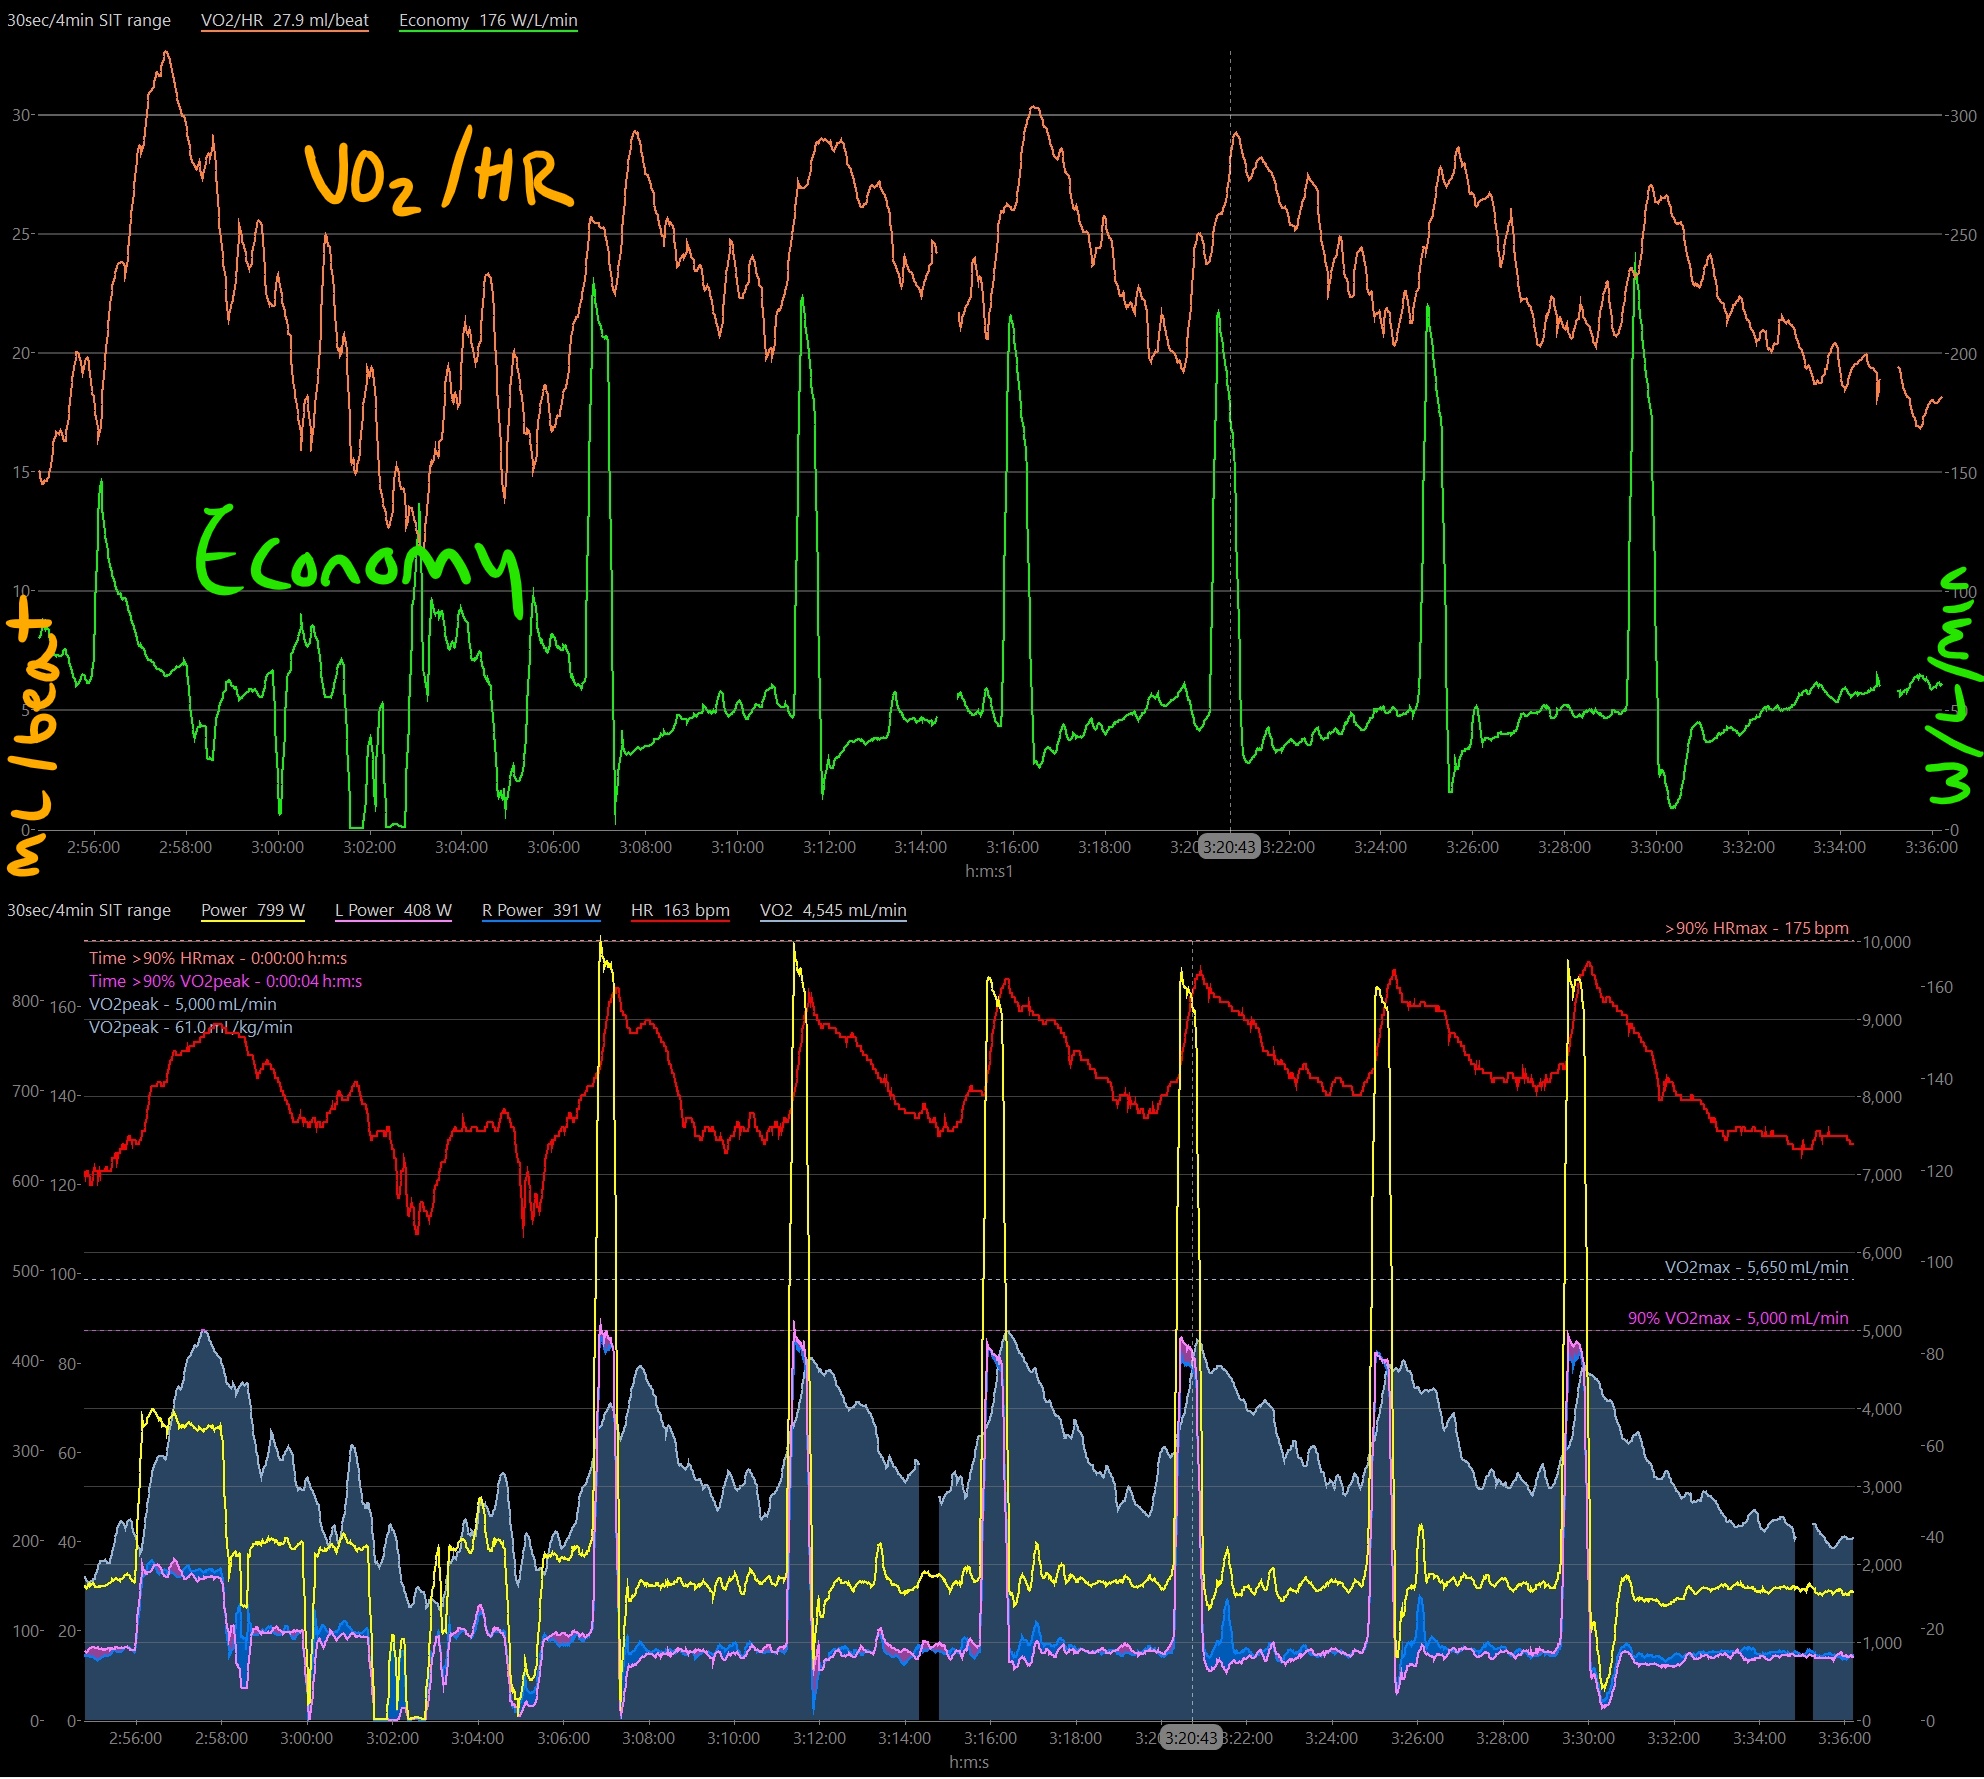
30sec/4min Sprint Intervals – Metabolic Efficiency (VO2 Master Pro) data
Top chart shows:
Orange line shows the ratio of VO2 to HR (mL/beat): how much oxygen is consumed per heart beat
Green line is Economy (W/L/min): the net power output per liter of oxygen consumed per minute
Bottom chart:
Performance data
VO2 (mL/min)
Both VO2/HR and Economy remain relatively constant across all intervals during the 30sec/4min sprint intervals. Peak VO2/HR (orange) sits just under 30 mL/beat and begins to decline slightly in the final few reps as I approach exhaustion, reflecting the decline in metabolic efficiency that we’ve already seen.
Economy remains at a constant peak of around 225 W/L/min. Meaning I am able to get the same relative power output per unit of oxygen consumed, I just have to work harder (higher HR) to produce that power. This could be used more broadly to decide how many repetitions are maximally effective in a workout, instead of simply guessing, or going home when the power output drops.
Compare this to the first set of 30/90sec intervals:
All-out 30/90sec to failure – Metabolic Efficiency (VO2 Master Pro) data
All same as above
Top chart: Orange is VO2/HR (mL/beat) & Green is Economy (W/L/min)
Bottom chart: Performance & VO2 (mL/min) data
The first interval shows a slightly higher peak economy (green) at just under 250 W/L/min, and the same peak VO2/HR (orange) at 30 mL/beat. However economy immediately begins to sharply decline on each subsequent work interval, and VO2/HR likewise drops considerably after the third rep where symptoms and muscle oxygen saturation (SmO2) were the primary limiting factors to power output.
Summary
Metabolic efficiency metrics like Economy & VO2/HR can give a better perspective on training stress and how your system is responding to training stimulus in real time, to maximize adaptations and minimize fatigue.
Despite being far more fatigued at the end of the workout, I was able to sustain higher metabolic efficiency when I lengthened the recovery intervals enough for the L leg to fully recover between 30sec maximal work intervals.
During these 30/90sec intervals to failure the lower power output, lower physiological stimulus and metabolic response, and obviously the symptoms of painful claudication were all signs that these intervals were counterproductive at allowing fitness adaptations.
If I want to improve my physiological fitness I need to work around this limiter. One way being to allow sufficient recovery between work intervals to normalize blood flow and oxygen delivery to my Left leg.